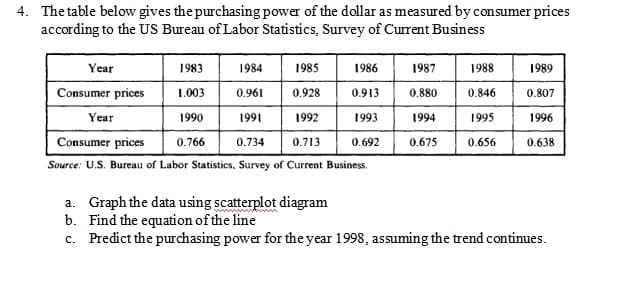
4. The table below gives the purchasing power of the dollar as measured by consumer prices according to the US Bureau of Labor Statistics, Survey of Current Business Year 1983 1984 1985 1986 1987 1988 1989 Consumer prices 1.003 0.961 0.928 0.913 0.880 0.846 0.807 Year 1990 1991 1992 1993 1994 1995 1996 Consumer prices 0.766 0.734 0.713 0.692 0.675 0.656 0.638 Source: U.S. Bureau of Labor Statistics, Survey of Current Business. a. Graph the data using scatterplot diagram b. Find the equation of the line c. Predict the purchasing power for the year 1998, assuming the trend continues.
4. The table below gives the purchasing power of the dollar as measured by consumer prices according to the US Bureau of Labor Statistics, Survey of Current Business Year 1983 1984 1985 1986 1987 1988 1989 Consumer prices 1.003 0.961 0.928 0.913 0.880 0.846 0.807 Year 1990 1991 1992 1993 1994 1995 1996 Consumer prices 0.766 0.734 0.713 0.692 0.675 0.656 0.638 Source: U.S. Bureau of Labor Statistics, Survey of Current Business. a. Graph the data using scatterplot diagram b. Find the equation of the line c. Predict the purchasing power for the year 1998, assuming the trend continues.

MATLAB: An Introduction with Applications
6th Edition
ISBN:9781119256830
Author:Amos Gilat
Publisher:Amos Gilat
Chapter1: Starting With Matlab
Section: Chapter Questions
Problem 1P

Related questions
Question
#4 A and B with complete solution and table
Transcribed Image Text:4. The table below gives the purchasing power of the dollar as measured by consumer prices
according to the US Bureau of Labor Statistics, Survey of Current Business
Year
1983
1984
1985
1986
1987
1988
1989
Consumer prices
1.003
0.961
0.928
0.913
0.880
0.846
0.807
Year
1990
1991
1992
1993
1994
1995
1996
Consumer prices
0.766
0.734
0.713
0.692
0.675
0.656
0.638
Source: U.S. Bureau of Labor Statistics, Survey of Current Business.
a. Graph the data using scatterplot diagram
b. Find the equation of the line
c. Predict the purchasing power for the year 1998, assuming the trend continues.
Expert Solution
This question has been solved!
Explore an expertly crafted, step-by-step solution for a thorough understanding of key concepts.

Step by step
Solved in 3 steps with 1 images

Recommended textbooks for you
MATLAB: An Introduction with Applications
Statistics
ISBN:
9781119256830
Author:
Amos Gilat
Publisher:
John Wiley & Sons Inc

Probability and Statistics for Engineering and th…
Statistics
ISBN:
9781305251809
Author:
Jay L. Devore
Publisher:
Cengage Learning

Statistics for The Behavioral Sciences (MindTap C…
Statistics
ISBN:
9781305504912
Author:
Frederick J Gravetter, Larry B. Wallnau
Publisher:
Cengage Learning
MATLAB: An Introduction with Applications
Statistics
ISBN:
9781119256830
Author:
Amos Gilat
Publisher:
John Wiley & Sons Inc
Probability and Statistics for Engineering and th…
Statistics
ISBN:
9781305251809
Author:
Jay L. Devore
Publisher:
Cengage Learning
Statistics for The Behavioral Sciences (MindTap C…
Statistics
ISBN:
9781305504912
Author:
Frederick J Gravetter, Larry B. Wallnau
Publisher:
Cengage Learning

Elementary Statistics: Picturing the World (7th E…
Statistics
ISBN:
9780134683416
Author:
Ron Larson, Betsy Farber
Publisher:
PEARSON

The Basic Practice of Statistics
Statistics
ISBN:
9781319042578
Author:
David S. Moore, William I. Notz, Michael A. Fligner
Publisher:
W. H. Freeman

Introduction to the Practice of Statistics
Statistics
ISBN:
9781319013387
Author:
David S. Moore, George P. McCabe, Bruce A. Craig
Publisher:
W. H. Freeman