2. Constructing a Lorenz curve from income shares data The following table shows the approximate income distribution for Colombia, Ukraine, and Turkey in 2011. In particulac, it shows the income shares of each quintile of the income distribution. Income Group Lowest quintile Second quintile Third quintile Fourth quintile Highest quintile Percentage of Total Income, 2011 Colombia Ukraine Turkey 2 9 5 10 14 21 50 6 11 18. 63 14 17 22 38 has the most total income. d' On the following graph, plot the Lorenz curves for the three countries. Plot Colombia's Lorene curve using the green points (triangle symbol), Ukraine's orenz curve using the blue points (circle symbol), and Turkey's Lorenz curve using the purple points (diamond symbol) Note: Plot your points in the order in which you would like them connected. Line segments will connect the points automatically.
2. Constructing a Lorenz curve from income shares data The following table shows the approximate income distribution for Colombia, Ukraine, and Turkey in 2011. In particulac, it shows the income shares of each quintile of the income distribution. Income Group Lowest quintile Second quintile Third quintile Fourth quintile Highest quintile Percentage of Total Income, 2011 Colombia Ukraine Turkey 2 9 5 10 14 21 50 6 11 18. 63 14 17 22 38 has the most total income. d' On the following graph, plot the Lorenz curves for the three countries. Plot Colombia's Lorene curve using the green points (triangle symbol), Ukraine's orenz curve using the blue points (circle symbol), and Turkey's Lorenz curve using the purple points (diamond symbol) Note: Plot your points in the order in which you would like them connected. Line segments will connect the points automatically.

Principles of Microeconomics (MindTap Course List)
8th Edition
ISBN:9781305971493
Author:N. Gregory Mankiw
Publisher:N. Gregory Mankiw
Chapter20: Income Inequality And Poverty
Section: Chapter Questions
Problem 5PA

Related questions
Question
Transcribed Image Text:nd Study Tools
tions
ccess Tips
cess Tips
Back
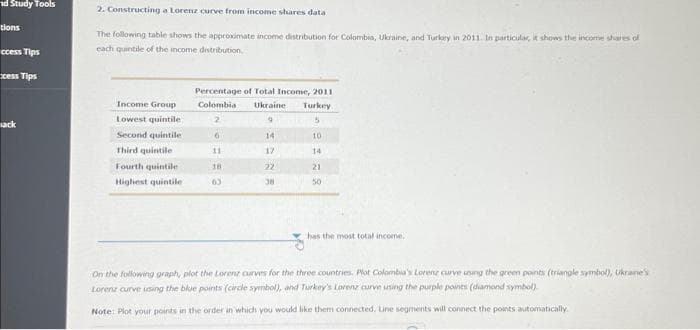
2. Constructing a Lorenz curve from income shares data
The following table shows the approximate income distribution for Colombia, Ukraine, and Turkey in 2011. In particular, it shows the income shares of
each quintile of the income distribution.
Income Group
Lowest quintile
Second quintile
Third quintile
Fourth quintile
Highest quintile
Percentage of Total Income, 2011
Turkey
Colombia Ukraine
2
9
5
6
14
10
17
14
21
50
18
63
22
38
has the most total income.
On the following graph, plot the Lorenz curves for the three countries. Plot Colombia's Lorenz curve using the green points (triangle symbol), Ukraine's
Lorenz curve using the blue points (circle symbol), and Turkey's Lorenz curve using the purple points (diamond symbol)
Note: Plot your points in the order in which you would like them connected. Line segments will connect the points automatically.
Expert Solution
This question has been solved!
Explore an expertly crafted, step-by-step solution for a thorough understanding of key concepts.

Step by step
Solved in 3 steps

Knowledge Booster


Learn more about
Need a deep-dive on the concept behind this application? Look no further. Learn more about this topic, economics and related others by exploring similar questions and additional content below.Recommended textbooks for you
Principles of Microeconomics (MindTap Course List)
Economics
ISBN:
9781305971493
Author:
N. Gregory Mankiw
Publisher:
Cengage Learning

Principles of Economics (MindTap Course List)
Economics
ISBN:
9781305585126
Author:
N. Gregory Mankiw
Publisher:
Cengage Learning

Principles of Economics, 7th Edition (MindTap Cou…
Economics
ISBN:
9781285165875
Author:
N. Gregory Mankiw
Publisher:
Cengage Learning
Principles of Microeconomics (MindTap Course List)
Economics
ISBN:
9781305971493
Author:
N. Gregory Mankiw
Publisher:
Cengage Learning
Principles of Economics (MindTap Course List)
Economics
ISBN:
9781305585126
Author:
N. Gregory Mankiw
Publisher:
Cengage Learning
Principles of Economics, 7th Edition (MindTap Cou…
Economics
ISBN:
9781285165875
Author:
N. Gregory Mankiw
Publisher:
Cengage Learning

Microeconomics: Principles & Policy
Economics
ISBN:
9781337794992
Author:
William J. Baumol, Alan S. Blinder, John L. Solow
Publisher:
Cengage Learning

Principles of Economics 2e
Economics
ISBN:
9781947172364
Author:
Steven A. Greenlaw; David Shapiro
Publisher:
OpenStax

Exploring Economics
Economics
ISBN:
9781544336329
Author:
Robert L. Sexton
Publisher:
SAGE Publications, Inc