2. Cost-Volume-Profit Chart The cost-volume-profit chart shows the relationship between sales volume, costs, and profit. To cre this chart, we need to calculate the following values: - Contribution Margin per Unit: Selling Price - Variable Cost per Unit - Contribution Margin Ratio: Contribution Margin per Unit / Selling Price - Break-Even Point: Fixed Costs / Contribution Margin per Unit - Profit: (Unit Sales * Selling Price) - (Unit Sales * Variable Cost per Unit) - Fixed Costs For the first 100 units of clever wearable devices, we can calculate these values as follows: - Contribution Margin per Unit: $150 $50 = $100 - Contribution Margin Ratio: $100/$150 = 0.67 or 67% - Break-Even Point: $10,000/$100 = 100 units - Profit: (Unit Sales $150) - (Unit Sales * $50) - $10,000 We can plot these values on a graph with unit sales on the x-axis and revenue, costs, and profit on the y-axis.
2. Cost-Volume-Profit Chart The cost-volume-profit chart shows the relationship between sales volume, costs, and profit. To cre this chart, we need to calculate the following values: - Contribution Margin per Unit: Selling Price - Variable Cost per Unit - Contribution Margin Ratio: Contribution Margin per Unit / Selling Price - Break-Even Point: Fixed Costs / Contribution Margin per Unit - Profit: (Unit Sales * Selling Price) - (Unit Sales * Variable Cost per Unit) - Fixed Costs For the first 100 units of clever wearable devices, we can calculate these values as follows: - Contribution Margin per Unit: $150 $50 = $100 - Contribution Margin Ratio: $100/$150 = 0.67 or 67% - Break-Even Point: $10,000/$100 = 100 units - Profit: (Unit Sales $150) - (Unit Sales * $50) - $10,000 We can plot these values on a graph with unit sales on the x-axis and revenue, costs, and profit on the y-axis.

Chapter7: Production And Cost In The Firm
Section: Chapter Questions
Problem 1.3P

Related questions
Question
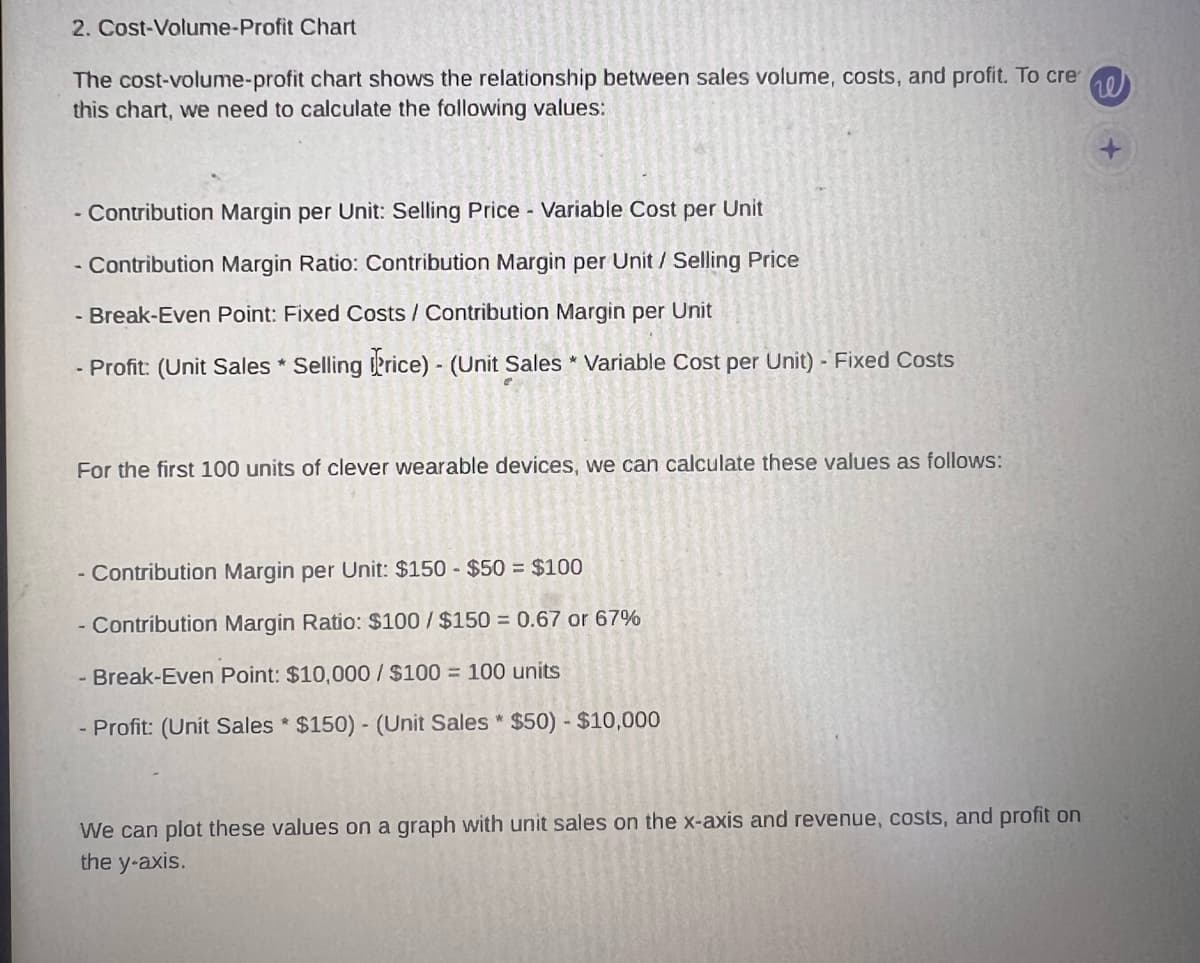
Transcribed Image Text:2. Cost-Volume-Profit Chart
The cost-volume-profit chart shows the relationship between sales volume, costs, and profit. To cre
this chart, we need to calculate the following values:
- Contribution Margin per Unit: Selling Price - Variable Cost per Unit
- Contribution Margin Ratio: Contribution Margin per Unit / Selling Price
- Break-Even Point: Fixed Costs / Contribution Margin per Unit
- Profit: (Unit Sales * Selling Price) - (Unit Sales * Variable Cost per Unit) - Fixed Costs
For the first 100 units of clever wearable devices, we can calculate these values as follows:
- Contribution Margin per Unit: $150 $50 = $100
- Contribution Margin Ratio: $100/$150 = 0.67 or 67%
- Break-Even Point: $10,000/$100 = 100 units
- Profit: (Unit Sales $150) - (Unit Sales * $50) - $10,000
We can plot these values on a graph with unit sales on the x-axis and revenue, costs, and profit on
the y-axis.
Expert Solution
This question has been solved!
Explore an expertly crafted, step-by-step solution for a thorough understanding of key concepts.

This is a popular solution!

Trending now
This is a popular solution!

Step by step
Solved in 2 steps

Recommended textbooks for you