2. Find the best fitting straight line to the following data. (iii) 1 2 27 3 4 14 40 55 68 (iv) x 2 4 1200 900 600 200 110 50
2. Find the best fitting straight line to the following data. (iii) 1 2 27 3 4 14 40 55 68 (iv) x 2 4 1200 900 600 200 110 50

Functions and Change: A Modeling Approach to College Algebra (MindTap Course List)
6th Edition
ISBN:9781337111348
Author:Bruce Crauder, Benny Evans, Alan Noell
Publisher:Bruce Crauder, Benny Evans, Alan Noell
Chapter3: Straight Lines And Linear Functions
Section3.4: Linear Regression
Problem 12SBE: Find the equation of the regression line for the following data set. x 1 2 3 y 0 3 4

Related questions
Question
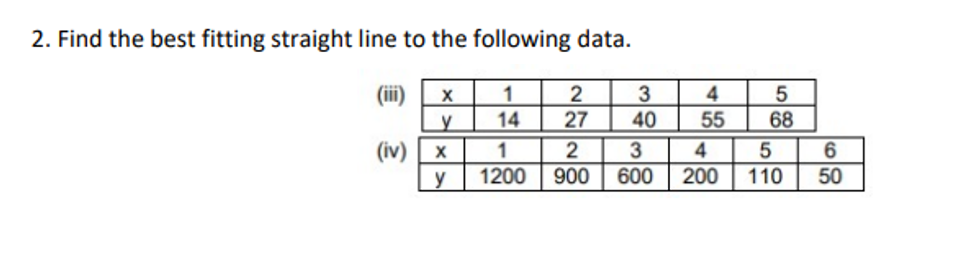
Transcribed Image Text:2. Find the best fitting straight line to the following data.
(ii)
1
3
4
14
27
40
55
68
(iv) x
1
3
4
6
y
1200
900
600
200
110
50
Expert Solution
This question has been solved!
Explore an expertly crafted, step-by-step solution for a thorough understanding of key concepts.

Step by step
Solved in 3 steps

Recommended textbooks for you
Functions and Change: A Modeling Approach to Coll…
Algebra
ISBN:
9781337111348
Author:
Bruce Crauder, Benny Evans, Alan Noell
Publisher:
Cengage Learning

Glencoe Algebra 1, Student Edition, 9780079039897…
Algebra
ISBN:
9780079039897
Author:
Carter
Publisher:
McGraw Hill

Algebra & Trigonometry with Analytic Geometry
Algebra
ISBN:
9781133382119
Author:
Swokowski
Publisher:
Cengage
Functions and Change: A Modeling Approach to Coll…
Algebra
ISBN:
9781337111348
Author:
Bruce Crauder, Benny Evans, Alan Noell
Publisher:
Cengage Learning
Glencoe Algebra 1, Student Edition, 9780079039897…
Algebra
ISBN:
9780079039897
Author:
Carter
Publisher:
McGraw Hill
Algebra & Trigonometry with Analytic Geometry
Algebra
ISBN:
9781133382119
Author:
Swokowski
Publisher:
Cengage