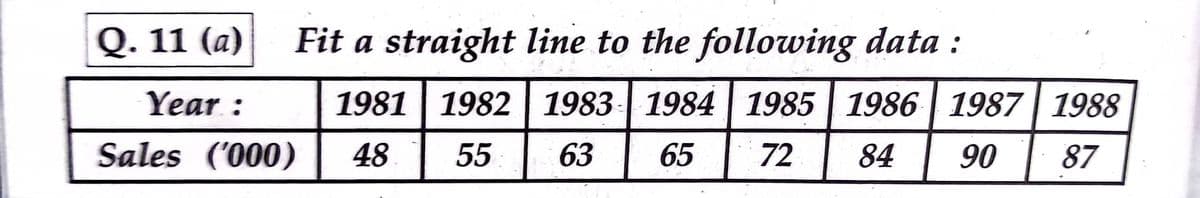
Q. 11 (a) Fit a straight line to the following data : Year : 1981 1982 1983| 1984 | 1985 | 1986 | 1987 | 1988 Sales ('000) 48 55 63 65 72 84 90 87


Q: 4. Consider the below data set: 65 87 x 75| 80 93 82 78 | 86 68 84 77 72 89 71 98 y 72 91 80 95 74…
A: Given: The data set: - x y 75 82 80 78 93 86 65 72 87 91 71 80 98 95 68 72 84…
Q: Use a graphing utility to find the line of best fit for the following data. y 9. 13 12 15 17 20 The…
A:
Q: 1. a. Plot the following data: 3. 6. 9. 12 15 18 -0.8 6.3 13.1 19.6 27.0 33.5 40.8
A: Hello! As you have posted more than 3 sub parts, we are answering the first 3 sub-parts. In case…
Q: 14. Here are data describing the air pollution rate (in pp) in a western city. Year: 1980 1985 1990…
A:
Q: e following table shows the length, in centimeters, of the humerus and the total wingspan, in…
A: Solution
Q: In the table below, data for two functions f and g are given. One of the functions is linear, and…
A: Given the table of data of f and g functionwe need to find out which function is linear . A function…
Q: 4. Consider the below data set: x 75 80 93 y 82 78 86 65 87 71 98 68 84 77 72 91 80 95 72 89 | 74…
A:
Q: In the following data, x is the average number of hours the student spent working on math each week…
A:
Q: 3 The following table contains the ACT scores and the GPA (grade point average) for eight college…
A: Hello. Since your question has multiple sub-parts, we will solve first three sub-parts for you. If…
Q: The table below sflows data from a study relating a man's age to the average number of miles he can…
A: We will use graphing calculator to find best fit for these data Let x = men's age and y = average…
Q: In the following data, x is the average number of hours the student spent working on math each week…
A:
Q: The graph below shows the global mean temperature in degrees Celsius (°C ) between 2000 and 2009,…
A: The slope of line = dy/dx = change in output/change in input Average rate of change = change in…
Q: Q 20: year mile hour 2001 4000 200 2002 4400 220 2003 2000 100 2004 3000 120 2005 4800 240 2006 5200…
A:
Q: Lindiwe suspected that the relationship between temperature and electricity consumption is not…
A: Given graph is : we need to predict the average unit of electricity used when the peak temperature…
Q: a) What value can be used to determine whether a straight line is suitable for describing the…
A: Here As PER POLICY I HAVE CALCULATED FIRST 3 SUBPART
Q: Here are the gold medal times for the women’s 100-meter freestyle (swimming) in every other Summer…
A: 1. The scatter plot for years and times in seconds is given below : 1. There is a negative…
Q: Commute Times in Minutes Stem Leaves 6. 0 0 3 3 4 6 7 8 1 8 1 2 4 5 6 6 Key: minutes %3D 34
A: Given: The steam and leaf plot represents the commute times in minutes. The provided stem and leaf…
Q: The table shows the number of CD players sold in a small electronics store in the years 1993-2003.…
A: Since you have asked question with multiple sub-parts, we are answering the first 3 sub-parts for…
Q: Portray the following hypothetical data on a two-variable diagram: Academic year Total…
A: Let us define the independent (X) and dependent (Y) first. Let , X be the total Enrollment /Year…
Q: I 2. Select the scatter plot that goes with the data shown b- most appropriate for the data. Day…
A:
Q: The table gives the percentage of persons in the United States under the age of 65 whose health…
A: Given that a table gives the percentage of persons in the United States under the age of 65 whose…
Q: Weekly Wages less than (Rs.) : 20 40 60 80 100 No. of workers 41 92 156 194 201 For the data given…
A:
Q: Q4. By plotting the graph of the given data mention whether there is a positive trend, negative…
A:
Q: Which functions may have been used to generate the following plot and its underlying data? a) lm()…
A: a) lm() function is used to create regression model. b) points() function is used to plot the…
Q: The box plots show the target heart rates of men 20-40 years old and men 50-70 years old. Target…
A: The Statement A is false
Q: The table below² shows the median monthly rent (in January) for a one-bedroom apartment in the Hyde…
A:
Q: A random sample of ten professional athletes produced the following data where x is the number of…
A: x y xy x2 y2 0 2 0 0 4 3 8 24 9 64 2 7 14 4 49 1 3 3 1 9 5 13 65 25 169 5 12…
Q: The histogram and the frequency table show the same information about the time that vehicles spent…
A: (1). The frequency table for the time that vehicles spent in a car park is given below: The…
Q: A study was conducted to detemine whether a the final grade of a student in an introductory…
A: Note: Since we only answer up to 3 sub-parts, we'll answer the first 3. Please resubmit the…
Q: The table shows the number of CD players sold in a small electronics store in the years 1993-2003.…
A: Since we only answer up to 3 sub-parts, we’ll answer the first 3. Please resubmit the question and…
Q: A used car company believes that there is a relationship between the amount spent on advertising and…
A: In order to get the scatter plot, we use R, Let x denote the "Amount spent on advertising" and y…
Q: The following table gives the amount spent on cellular service. Cellular service revenue Date (in…
A: The given table: Let t be the number of years since 2011. That is, In 2011: t=0…
Q: . Find the best fitting straight line to the following data. (i) 1 4 4 3 11 (ii) 10 15 20 25 15 19…
A: Two data set are given. We need to find the best fitting straight line. The solution is given below.
Q: 4. Consider the below data set: X 75 80 93 65 87 71 98 68 84 77 y 82 78 86 72 91 80 95 72 89 74 (a)…
A: Hi! Thank you for the question as per the honour code, we’ll answer the first question since the…
Q: When people were asked how much money they spent yesterday (in dollars), th was their data: 20 1 34…
A: Hi! Thank you for the question, As per the honor code, we are allowed to answer one question at a…
Q: For the following bookstore sales data, the correlation is 0.965. Number of Salespeople Working…
A: g) Compute the slope of the regression line using the formula: b=rsysx Where, 'r' is the correlation…
Q: The average price (in cents) per pound of sugar observed during the period September 2012 to…
A: given graph is Average price of sugar in November…
Q: Which of the slopes matches best with the slope of the data in the scatter plot? would it be m =…
A: From the given scatter plot, the points are distributed towards downward side. That is, the slope of…
Q: Interpolate the Sales for 1990 from the following data. Years : 1988 1989 1990 1991 1992 Sales : 250…
A: @solution:::
Q: A scientist believes that, over the years, the number of major earthquakes has been decreasing. To…
A: The given bivariate data was represented graphically, which is otherwise regarded as scatter…
Q: Which of the following indicates that a data set can be modelled using a linear function?
A: Let a data set is given as {a1, a2, a3, ...... } This data set is linear if a2-a1 = a3-a2 = .......…
Q: 2. A researcher measures the relationship between education (in years) and investment gains (in…
A: Given: n=4
Q: The following is a table of the ages, in months, (X) of 7 infants and the number of hours (Y) each…
A: Given the table of the ages, in months, (X) of 7 infants and the number of hours (Y) each slept in a…
Q: Fit a straight line trend .by. the method of least sqúåres to the following data and estimate the…
A:
Q: The following data refers to the amount of caffeine (in mg) consumed by ten university students and…
A: In the given scenario, we need to predict the time that students took to complete a practice exam…
Q: Which values should you plot to show a linear relationship? Month Population Log(population) 1 1400…
A: Enter the data in Excel.
Q: By plotting the graph of the given data mention whether there is a positive trend, negative trend or…
A: The graph for the data can be plot using Minitab: Open the Minitab sheet and enter the data of Xi…
Q: For each set of data use software or a graphing calculator to find the equation and coefficient of…
A: The regression is done to fit a data set into an equation. A graphing utility can be used to perform…

Step by step
Solved in 3 steps with 2 images

- The driver of a certain bus line traveled 1000 km in four sections of 250 km each, with speeds of 92 km / h, 85 km / h, 95 km / h and 80 km / h, respectively. Calculate the average speed with which he made the trip and compare it with the harmonic mean of the data.A population has a mean of µ = 51 and a standard deviation of σ = 7 For this population, find the z-score corresponding to each of the followingscores. Plot each point on a graph.X = 55 X = 40 X = 35X = 48 X = 70 X = 65Assume that the averages of all factors other than educ have remained constant over time and that the average level of education is 12.2 for the 1972 sample and 13.3 in the 1984 sample.Using the estimates in Table 13.1, find the estimated change in average fertility between 1972 and 1984. (Be sure to account for the intercept change and the change in average education.)
- Find the linear correlation coefficient for stride length versus speed of an adult man inTable 12.8a. Round your result to the nearest hundredth.Given the observed values of a function 168, 120, 72 and 63 respectively at the four positions 3, 7, 9 and 10 of the independent variable. Find the best estimate value of a function at the position 6 of the independent variableThe MAD for the forecast developed using a weighted 2-year moving average with weights of 0.350.35 and 0.650.65 is what?
- The distribution of bladder volume in men is approximately Normal with mean 550 milliliters (ml) and standard deviation 100 ml. In women, bladder volumes are approximately Normal with mean 400 ml and standard deviation 75 ml. Refer to the plot of these two distributions and use the 68-95-99.7 rule to answer the questions.For a certain type of computers, the length of time between charges of the battery is normally distributed with a mean of 50 hours and a standard deviation of 15 hours. Write down the function, draw bell-shaped curve & calculate the: a)Area between 50 and 70 hours. b)Area above 40 hours. c)X value that has 28% area above it. d)X value that has 60% area below it.Answer only 4-10 and sketch the normal curve.
- Determine the equation of the normal line to the graph of the function in the picture at x=1.Calculate the slope of the normal line to the graph of the function shown in the image at point x=1.. In a county male height is normally distributed with a mean of 175 cmand a standard deviation of 6 cm. What percentage of males have aheight between 168 cm and 172 cm? Sketch the graph.