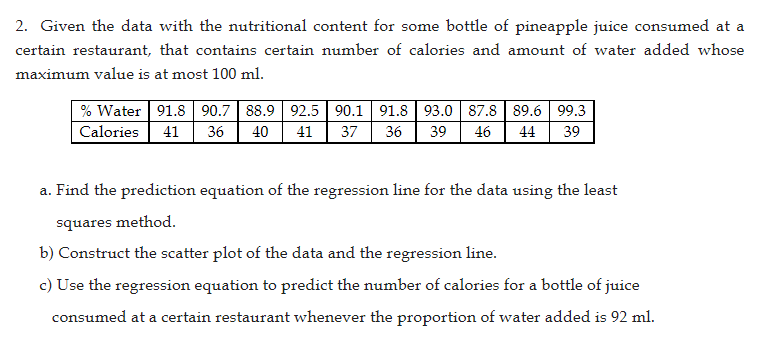
2. Given the data with the nutritional content for some bottle of pineapple juice consumed at a certain restaurant, that contains certain number of calories and amount of water added whose maximum value is at most 100 ml. % Water 91.8 90.7 88.9 92.5 90.1 91.8 93.0 87.8 89.6 99.3 Calories 41 36 40 41 37 36 39 46 44 39 a. Find the prediction equation of the regression line for the data using the least squares method. b) Construct the scatter plot of the data and the regression line. c) Use the regression equation to predict the number of calories for a bottle of juice consumed at a certain restaurant whenever the proportion of water added is 92 ml.
2. Given the data with the nutritional content for some bottle of pineapple juice consumed at a certain restaurant, that contains certain number of calories and amount of water added whose maximum value is at most 100 ml. % Water 91.8 90.7 88.9 92.5 90.1 91.8 93.0 87.8 89.6 99.3 Calories 41 36 40 41 37 36 39 46 44 39 a. Find the prediction equation of the regression line for the data using the least squares method. b) Construct the scatter plot of the data and the regression line. c) Use the regression equation to predict the number of calories for a bottle of juice consumed at a certain restaurant whenever the proportion of water added is 92 ml.

College Algebra
7th Edition
ISBN:9781305115545
Author:James Stewart, Lothar Redlin, Saleem Watson
Publisher:James Stewart, Lothar Redlin, Saleem Watson
Chapter1: Equations And Graphs
Section: Chapter Questions
Problem 10T: Olympic Pole Vault The graph in Figure 7 indicates that in recent years the winning Olympic men’s...

Related questions
Question
100%
PLS DO HELP ME!
Transcribed Image Text:2. Given the data with the nutritional content for some bottle of pineapple juice consumed at a
certain restaurant, that contains certain number of calories and amount of water added whose
maximum value is at most 100 ml.
% Water 91.8 90.7 88.9 92.5 90.1 91.8 93.0 87.8 89.6 99.3
Calories 41 36 40 41 37 36 39 46 44 39
a. Find the prediction equation of the regression line for the data using the least
squares method.
b) Construct the scatter plot of the data and the regression line.
c) Use the regression equation to predict the number of calories for a bottle of juice
consumed at a certain restaurant whenever the proportion of water added is 92 ml.
Expert Solution
This question has been solved!
Explore an expertly crafted, step-by-step solution for a thorough understanding of key concepts.

This is a popular solution!

Trending now
This is a popular solution!

Step by step
Solved in 5 steps with 4 images

Recommended textbooks for you
College Algebra
Algebra
ISBN:
9781305115545
Author:
James Stewart, Lothar Redlin, Saleem Watson
Publisher:
Cengage Learning

Linear Algebra: A Modern Introduction
Algebra
ISBN:
9781285463247
Author:
David Poole
Publisher:
Cengage Learning

Glencoe Algebra 1, Student Edition, 9780079039897…
Algebra
ISBN:
9780079039897
Author:
Carter
Publisher:
McGraw Hill
College Algebra
Algebra
ISBN:
9781305115545
Author:
James Stewart, Lothar Redlin, Saleem Watson
Publisher:
Cengage Learning
Linear Algebra: A Modern Introduction
Algebra
ISBN:
9781285463247
Author:
David Poole
Publisher:
Cengage Learning
Glencoe Algebra 1, Student Edition, 9780079039897…
Algebra
ISBN:
9780079039897
Author:
Carter
Publisher:
McGraw Hill

Functions and Change: A Modeling Approach to Coll…
Algebra
ISBN:
9781337111348
Author:
Bruce Crauder, Benny Evans, Alan Noell
Publisher:
Cengage Learning

Big Ideas Math A Bridge To Success Algebra 1: Stu…
Algebra
ISBN:
9781680331141
Author:
HOUGHTON MIFFLIN HARCOURT
Publisher:
Houghton Mifflin Harcourt