2. Here is the equation of the list squares of regression line: y=31.9-0.304x. Sample size is 13. S= 3.667. S. -13.033. = 58.23 (a) Do the test of hypothesis: H,: B = 0; Hạ:B +0 What is SE,? What is the t value? What is the degree of freedom? What is the p-value? Should the null hypothesis be rejected if the significance level is a =0.05? Continue or not? ( Hint: Consider the formula of S. (b) Ifx 60, Find the 95% confidence interval for the single predicted value ŷ.
2. Here is the equation of the list squares of regression line: y=31.9-0.304x. Sample size is 13. S= 3.667. S. -13.033. = 58.23 (a) Do the test of hypothesis: H,: B = 0; Hạ:B +0 What is SE,? What is the t value? What is the degree of freedom? What is the p-value? Should the null hypothesis be rejected if the significance level is a =0.05? Continue or not? ( Hint: Consider the formula of S. (b) Ifx 60, Find the 95% confidence interval for the single predicted value ŷ.

Glencoe Algebra 1, Student Edition, 9780079039897, 0079039898, 2018
18th Edition
ISBN:9780079039897
Author:Carter
Publisher:Carter
Chapter4: Equations Of Linear Functions
Section4.6: Regression And Median-fit Lines
Problem 4GP

Related questions
Question
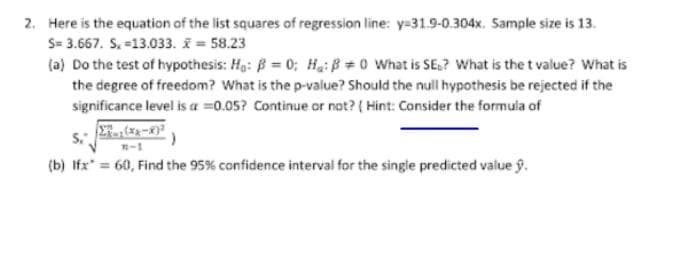
Transcribed Image Text:2. Here is the equation of the list squares of regression line: y=31.9-0.304x. Sample size is 13.
S= 3.667. S. -13.033. = 58.23
(a) Do the test of hypothesis: Hg: B = 0; H:B +0 What is SE.? What is the t value? What is
the degree of freedom? What is the p-value? Should the null hypothesis be rejected if the
significance level is a =0.05? Continue or not? ( Hint: Consider the formula of
R-1
(b) Ifx 60, Find the 95% confidence interval for the single predicted value ý.
Expert Solution
This question has been solved!
Explore an expertly crafted, step-by-step solution for a thorough understanding of key concepts.

Step by step
Solved in 3 steps

Recommended textbooks for you
Glencoe Algebra 1, Student Edition, 9780079039897…
Algebra
ISBN:
9780079039897
Author:
Carter
Publisher:
McGraw Hill

Linear Algebra: A Modern Introduction
Algebra
ISBN:
9781285463247
Author:
David Poole
Publisher:
Cengage Learning

College Algebra
Algebra
ISBN:
9781305115545
Author:
James Stewart, Lothar Redlin, Saleem Watson
Publisher:
Cengage Learning
Glencoe Algebra 1, Student Edition, 9780079039897…
Algebra
ISBN:
9780079039897
Author:
Carter
Publisher:
McGraw Hill
Linear Algebra: A Modern Introduction
Algebra
ISBN:
9781285463247
Author:
David Poole
Publisher:
Cengage Learning
College Algebra
Algebra
ISBN:
9781305115545
Author:
James Stewart, Lothar Redlin, Saleem Watson
Publisher:
Cengage Learning