2. Max is collecting data on the number of minutes some members of the school's football team spend playing, and the number of points each member scored. The data he collected is displayed below. Member Mlinutes Points Played Scored Kim 31 10 Aksbax. 28 7. John 55 18 Les 62 62 Ainan 17 Lee 44 15 Vlad 73 30 Ryan 49 Min Suk 68 23 a. Use technology to create s scatter plot. b. Is there a trend in the number of minutes played and the number of points scored? If so, describe the trend. C. Identify any outliers and suggest reasons for the outlier(s). Then. remove the outlier(s) and draw s line of best fit.
2. Max is collecting data on the number of minutes some members of the school's football team spend playing, and the number of points each member scored. The data he collected is displayed below. Member Mlinutes Points Played Scored Kim 31 10 Aksbax. 28 7. John 55 18 Les 62 62 Ainan 17 Lee 44 15 Vlad 73 30 Ryan 49 Min Suk 68 23 a. Use technology to create s scatter plot. b. Is there a trend in the number of minutes played and the number of points scored? If so, describe the trend. C. Identify any outliers and suggest reasons for the outlier(s). Then. remove the outlier(s) and draw s line of best fit.

Glencoe Algebra 1, Student Edition, 9780079039897, 0079039898, 2018
18th Edition
ISBN:9780079039897
Author:Carter
Publisher:Carter
Chapter10: Statistics
Section10.5: Comparing Sets Of Data
Problem 26PFA

Related questions
Question
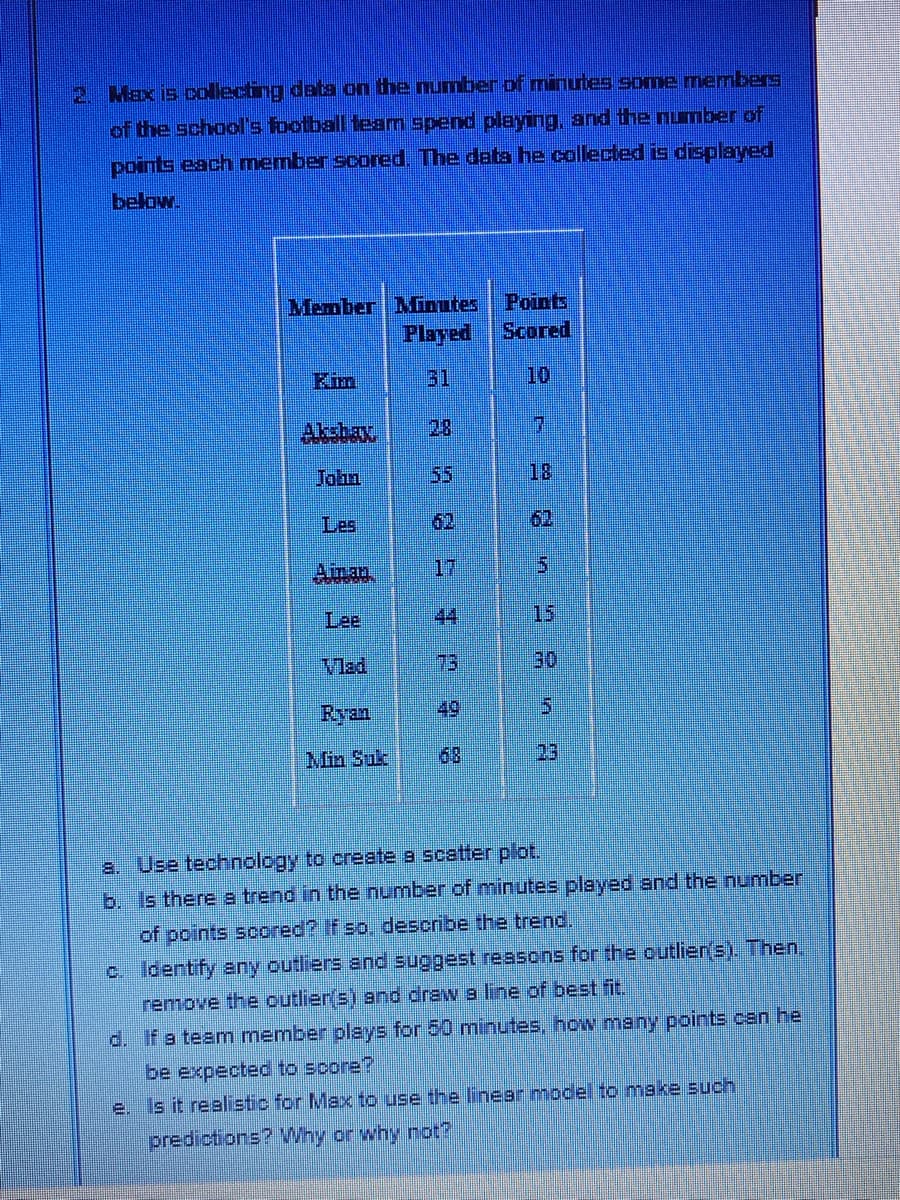
Transcribed Image Text:2. Max is collecting data on the number of minutes some members
of the school's football team spend playing, and the number of
points each member scored. The data he collected is displayed
below.
Member Mlinutes
Played
Points
Scored
Kim
31
10
Aksbax
28
7.
Jahn
55
18
Les
62
62
Aman.
17
Lee
44
15
Vlad
73
Ryan
49
Min Suk
68
23
a. Use technology to create s scatter plot.
b. Is there a trend in the number of minutes played and the number
of points scored? If so, describe the trend.
c ldentify any outliers and suggest reasons for the outliers). Then.
remove the outlier(s) and drew a line of best fit.
d. If a team member plays for 50 minutes, how many points can he
be expected to score?
e. Is it reslistic for Max to use the linear model to make such
predictions? Why or why not?
98n コ3n吕
Expert Solution
This question has been solved!
Explore an expertly crafted, step-by-step solution for a thorough understanding of key concepts.

Step by step
Solved in 4 steps with 2 images

Recommended textbooks for you
Glencoe Algebra 1, Student Edition, 9780079039897…
Algebra
ISBN:
9780079039897
Author:
Carter
Publisher:
McGraw Hill

Holt Mcdougal Larson Pre-algebra: Student Edition…
Algebra
ISBN:
9780547587776
Author:
HOLT MCDOUGAL
Publisher:
HOLT MCDOUGAL
Glencoe Algebra 1, Student Edition, 9780079039897…
Algebra
ISBN:
9780079039897
Author:
Carter
Publisher:
McGraw Hill
Holt Mcdougal Larson Pre-algebra: Student Edition…
Algebra
ISBN:
9780547587776
Author:
HOLT MCDOUGAL
Publisher:
HOLT MCDOUGAL