103289 130023 16068 3286 24089 6309 14502 | 62595 23666 35833 96 71 76 112 43 87 131 136 80 52 (a) Use Excels Data Analysis to find the equation of the regression line and a Line Fit Plot. Write the equation of the regression line. Do you think the line gives accurate predictions? Why? (b) Delete the observation with largest x value from the data set. Redo the Data Analysis to obtain the new equation of the regression line and the new Line Fit Plot calculations for the new data set. Write the equation of the regression line. Does this observation greatly affect the equation of the line? Compare the signs of the slopes of the two regression lines.
103289 130023 16068 3286 24089 6309 14502 | 62595 23666 35833 96 71 76 112 43 87 131 136 80 52 (a) Use Excels Data Analysis to find the equation of the regression line and a Line Fit Plot. Write the equation of the regression line. Do you think the line gives accurate predictions? Why? (b) Delete the observation with largest x value from the data set. Redo the Data Analysis to obtain the new equation of the regression line and the new Line Fit Plot calculations for the new data set. Write the equation of the regression line. Does this observation greatly affect the equation of the line? Compare the signs of the slopes of the two regression lines.

MATLAB: An Introduction with Applications
6th Edition
ISBN:9781119256830
Author:Amos Gilat
Publisher:Amos Gilat
Chapter1: Starting With Matlab
Section: Chapter Questions
Problem 1P

Related questions
Question
100%
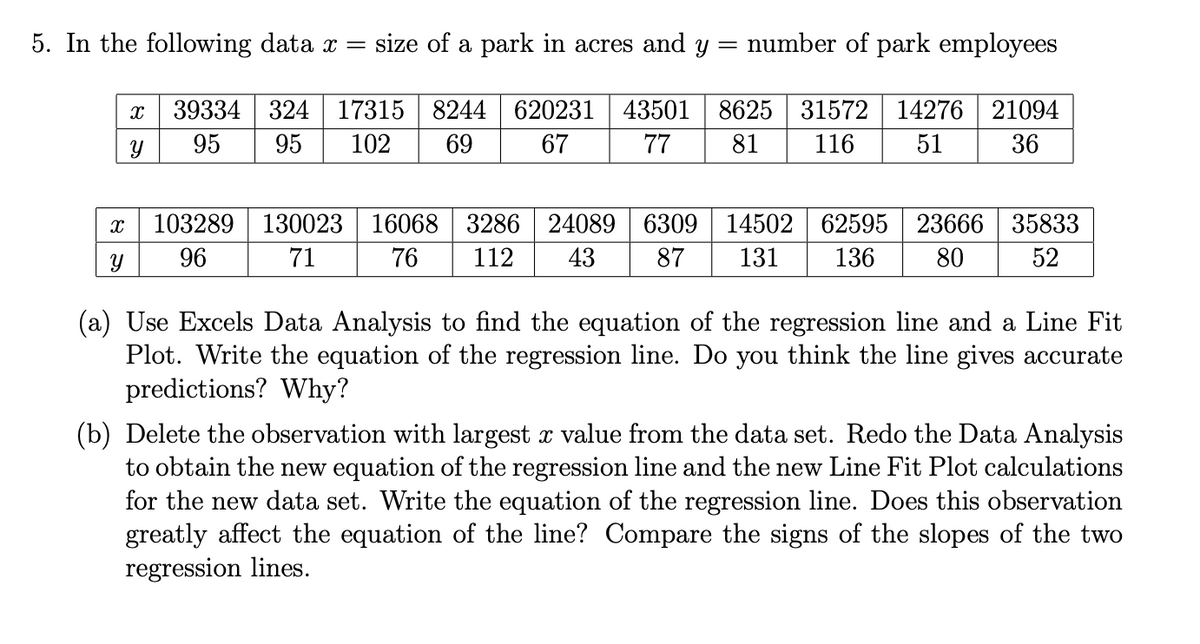
Transcribed Image Text:5. In the following data x=
size of a park in acres and y
number of park employees
39334 324
17315 8244
620231
43501
8625 31572 14276 21094
95
95
102
69
67
77
81
116
51
36
103289 130023 16068 3286 24089
6309
14502 62595 23666 35833
96
71
76
112
43
87
131
136
80
52
(a) Use Excels Data Analysis to find the equation of the regression line and a Line Fit
Plot. Write the equation of the regression line. Do you think the line gives accurate
predictions? Why?
(b) Delete the observation with largest x value from the data set. Redo the Data Analysis
to obtain the new equation of the regression line and the new Line Fit Plot calculations
for the new data set. Write the equation of the regression line. Does this observation
greatly affect the equation of the line? Compare the signs of the slopes of the two
regression lines.
Expert Solution
This question has been solved!
Explore an expertly crafted, step-by-step solution for a thorough understanding of key concepts.

Step by step
Solved in 4 steps with 4 images

Recommended textbooks for you
MATLAB: An Introduction with Applications
Statistics
ISBN:
9781119256830
Author:
Amos Gilat
Publisher:
John Wiley & Sons Inc

Probability and Statistics for Engineering and th…
Statistics
ISBN:
9781305251809
Author:
Jay L. Devore
Publisher:
Cengage Learning

Statistics for The Behavioral Sciences (MindTap C…
Statistics
ISBN:
9781305504912
Author:
Frederick J Gravetter, Larry B. Wallnau
Publisher:
Cengage Learning
MATLAB: An Introduction with Applications
Statistics
ISBN:
9781119256830
Author:
Amos Gilat
Publisher:
John Wiley & Sons Inc
Probability and Statistics for Engineering and th…
Statistics
ISBN:
9781305251809
Author:
Jay L. Devore
Publisher:
Cengage Learning
Statistics for The Behavioral Sciences (MindTap C…
Statistics
ISBN:
9781305504912
Author:
Frederick J Gravetter, Larry B. Wallnau
Publisher:
Cengage Learning

Elementary Statistics: Picturing the World (7th E…
Statistics
ISBN:
9780134683416
Author:
Ron Larson, Betsy Farber
Publisher:
PEARSON

The Basic Practice of Statistics
Statistics
ISBN:
9781319042578
Author:
David S. Moore, William I. Notz, Michael A. Fligner
Publisher:
W. H. Freeman

Introduction to the Practice of Statistics
Statistics
ISBN:
9781319013387
Author:
David S. Moore, George P. McCabe, Bruce A. Craig
Publisher:
W. H. Freeman