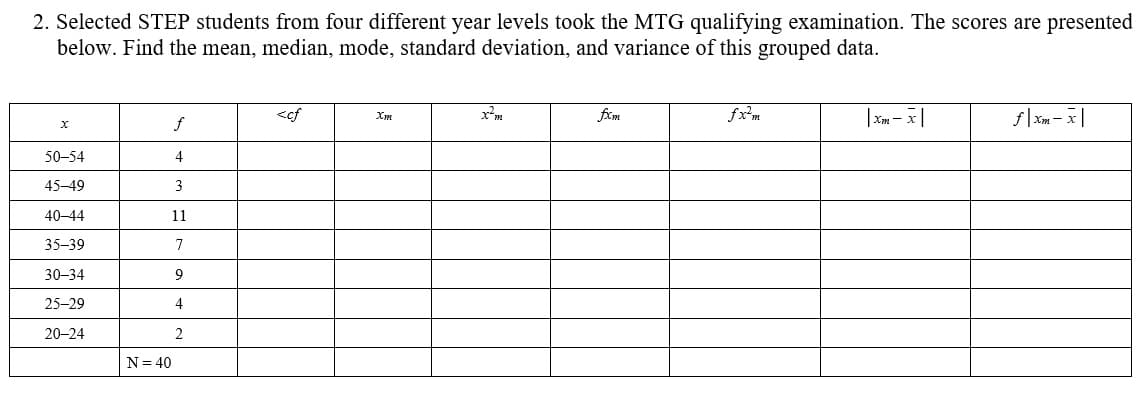
2. Selected STEP students from four different year levels took the MTG qualifying examination. The scores are presented below. Find the mean, median, mode, standard deviation, and variance of this grouped data.
Q: 2. The efficiency ratings of 200 faculty members of a certain college were taken and are show below.…
A: Given: n=200 Mean, Median, Mode, Population standard deviation=?
Q: The following set of data is from a sample of n = 7. 7 3 4 12 8 3 5 0 a. Compute the mean, median,…
A: (a) Use EXCEL Procedure for finding the values of mean, median and mode. Follow the instruction…
Q: 3. Find out the value of quartile deviation and its coefficient from the follev dadi. Roll No. 1 4…
A:
Q: A magazine claims that the mean amount spent by a customer at Burger Stop is greater than the mean…
A: GivenFor Burger stopx1=5.46s1=0.89n1=22For Fry Worldx2=5.12s2=0.79n2=30α=0.05
Q: 3. Rish Florist determines the probabilities for the number of flower arrangements they deliver each…
A: Let X be the random variable having probability distribution is, X 6 7 8 9 10 P(x) 0.2 0.2…
Q: Use the following information to answer the question. The distribution of the number of hours people…
A: Given: Population mean μ=8 Population standard deviation σ=0.5 Number of hours worked = 8.7
Q: This data is from a sample. Calculate the mean, standard deviation, and variance. 27.5 42.2 33.4…
A: The mean of the data is calculated as follows: Mean=1n∑i=1nxi =1827.5+42.2+...+16…
Q: 3. Find the variance and Standard Deviation of the given data obtained from the test of 56 students.…
A: Ans#- Find Sample Variance (s2) Sample Standard deviation (s) from the following grouped data…
Q: 3. Using the table below, answer the following correctly. Number of hours Student No. Hours (x) 1 45…
A:
Q: Which of the following would indicate that a dataset is not bell-shaped? A. The mean is much…
A:
Q: Please refer to the table below. Number of Inquiries X 22 25 26 28 29 30 P(x) 0.08 0.19…
A: Solution
Q: Scores 30-34 6. 35-39 16 40-44 15 45-49 12 50-54 4
A: We know that Mean = sum of all observations/total number of observations
Q: A pet association claims that the mean annual costs of food for dogs and cats are the same. The…
A: From the provided information,
Q: The following set of data is from a sample of n=7. 5 4 12 11 10 4 3 a.…
A: The mean of a data set is calculated by dividing the sum of observations with the number of…
Q: 12. Below is a data set for number of toys a child owns in a particular neighborhood: ABCDEFG|H…
A: toatal no. of child N=8total number of toyes ∑xi =2+4+4+3+2+3+2+4=24
Q: 3. The monthly number of cars sold by a car dealer from January to October for a particular year…
A:
Q: .5 .25 1.4 1.5 .85 .20 1.5 1.75 .10 .65 .75 2 1 1.10 1.65 1.4 .6 .35 .40 .25 a. What is the mean…
A: Given: n=20 The table below shows the data. 0.5 0.25 1.4 1.5 0.85 0.2 1.5 1.75 0.1 0.65 0.75…
Q: Which of the following is not a measure of the dispersion of data in a sample
A: Here Given MAD,Variance ,IQR , Mean deviation
Q: Suppose that a publisher conducted a survey asking adult consumers the number of fiction paperback…
A: Since you have asked multiple question, we will solve the first question for you. If youwant any…
Q: A simple forecasting method for weekly sales of flash drives used by a localcomputer dealer is to…
A: The forecast error in t, et is the difference between forecast for demand in period t and actual…
Q: Below is a sample of share prices (in dollars) for a particular stock, selected at random over…
A: Given: Data on sample share prices. Step-by-step procedure to obtain the Descriptive statistics…
Q: The following set of data is from a sample of n =7. 7 0 4 2 9 0 13O a. Compute the mean, median, and…
A:
Q: 4. Consider the following frequency distribution below: Classes 11-21 22-32 19 33-43 31 44-54 39…
A:
Q: The following data provided are the average hours fifty-six grade 8 students spent doing their…
A: Range is the difference between largest and smallest observation. And variance is the measure of…
Q: 3) Number of Probability, speeches, P(x) 0.06 1. 0.42 0.22 0.12 0.15 0.03 Mean = Variance= Standard…
A: 3) The probability distribution table is given for number of speeches.
Q: The following data represent the difference in scores between the winning and losing teams in a…
A: The following data represent the difference in scores between the winning and losing teams in a…
Q: Find the mean, standard deviation and skewness of the distribution. 0-5 5-10 10-15 15-20 20-25 25-30…
A:
Q: 1. The hourly rate of 100 college faculty members at Merriam College, Quezon City are distributed…
A: A measure of central tendency represents the central value or typical value of a set of…
Q: Compute standard deviation and its coefficient from the following data: - -10 10-15 15-20 20-30 30-…
A:
Q: :- Find the mean absolute deviation (M.A.D.), standard deviation (S), and coefficient of variance…
A:
Q: The math grades of the 40 students in a class are given by the table 1 2 3 4 5 6 7 8 9 X₁ F₁ 1 3 5 6…
A:
Q: The asking prices (in thousands of dollars) for a sample of 13 houses currently on the market in…
A: It is given that the price of homes the following month all increase by 25%. The mean is affected by…
Q: Q) Consider the following ungrouped data: 41 46 7 46 32 5 14 28 48 49 8 49 48 25 41 8 22 46 40 48…
A: Arithmetic mean : Arithmetic mean is the sum of all observations divided by total number of…
Q: A textile manufacturer obtained a sample of 50 bolts of cloth from a day’s output. Each bolt is…
A: The cumulative frequencies are obtained in the below table:
Q: a) Two data sets both have a mean of 50. One has a standard deviation of 2 and the other has a…
A: a) Provided information, two data sets have mean as 50. One is having standard deviation as 2 and…
Q: The following is a set of data from a sample of n=5. 3 4 8 1 5 a. Compute the…
A: a. Mean: Mean is the expected value of a set of observations. In other words, mean is the average of…
Q: The bar graph below summarizes information aNew York City Survey of Elementary School Children(NYC…
A: If X is the number of children among 400 Hispanic NYC school children that are obese,then…
Q: 4 Given that the approximate shape for the distribution of a data set is right-skewed (positive). If…
A: We have to find correct option.
Q: Firm Number of cars Mean no. of Standard deviation breakdown A 35 3.46 0.842 37 3.64 0.955
A: We have given that, Mean1= 3.46 and Mean2 = 3.64. Standard deviation1 = 0.842 and Standard…
Q: Below is a data set of n = 16 that expresses the overall miles per gallon (MPG) of family sedans:…
A:
Q: 2) in a spot speed study for a highway section, the data were collected and shown in the table…
A: As per guidelines we will only answer first three subparts, please repost other subparts for more…
Q: A sample of voters in a town are classified by age groups, as shown by the following: Age Group 21 –…
A:
Q: Q2/ The number of faculty listed for a variety of private colleges that offer only bachelor's…
A: The number of faculty listed for a variety of private colleges that offer only bachelor's degrees is…
Q: Q3/ The following data represent the lifetimes of light bulbs (in months), frequency distribution…
A: Measure of central tendency measures the central or average value of a dataset. Measured of…
Q: The following table gives a sample of the percentage of current users of alcohol and cigarettes in…
A: The mean, sample variance, sample standard deviation for Alcohol is obtained by using Excel.In Excel…
Q: 2. Please find the following: X-BAR (sample mean), b. "S" (sample standard deviation, +/- 1, 2 and 3…
A: For the given data Find mean,s.d,variance,draw bell curve
Q: . The ungrouped data below shows the different temperatures measured during n experiment. Construct…
A: The objective is to construct a frequency table for the ungrouped data and calculate its mean,…
Q: the following are the scores of ten ABM students in their fourth-quarter examination: 26 37 45 35…
A: Solution: Let X be the scores. The given data is 26, 37, 45, 35, 31, 47, 23, 34, 44 and 38.
Q: Q2. Find the mean deviation, standard deviation and variance for the following frequency…
A:
Q: B. The following data show the age of 180 random consumer of facial wash in a supermarket. Calculate…
A: Given data is Age No. of consumer(f) 9-15 12 16-22 52 23-29 68 30-36 28 37-43 13…
Step by step
Solved in 4 steps