The following set of data is from a sample of n =7. 7 0 4 2 9 0 13O a. Compute the mean, median, and mode. 5. Compute the range, variance, standard deviation, and coefficient of variation. C. Compute the Z scores. Are there any outliers?
The following set of data is from a sample of n =7. 7 0 4 2 9 0 13O a. Compute the mean, median, and mode. 5. Compute the range, variance, standard deviation, and coefficient of variation. C. Compute the Z scores. Are there any outliers?

Glencoe Algebra 1, Student Edition, 9780079039897, 0079039898, 2018
18th Edition
ISBN:9780079039897
Author:Carter
Publisher:Carter
Chapter10: Statistics
Section10.4: Distributions Of Data
Problem 19PFA

Related questions
Question

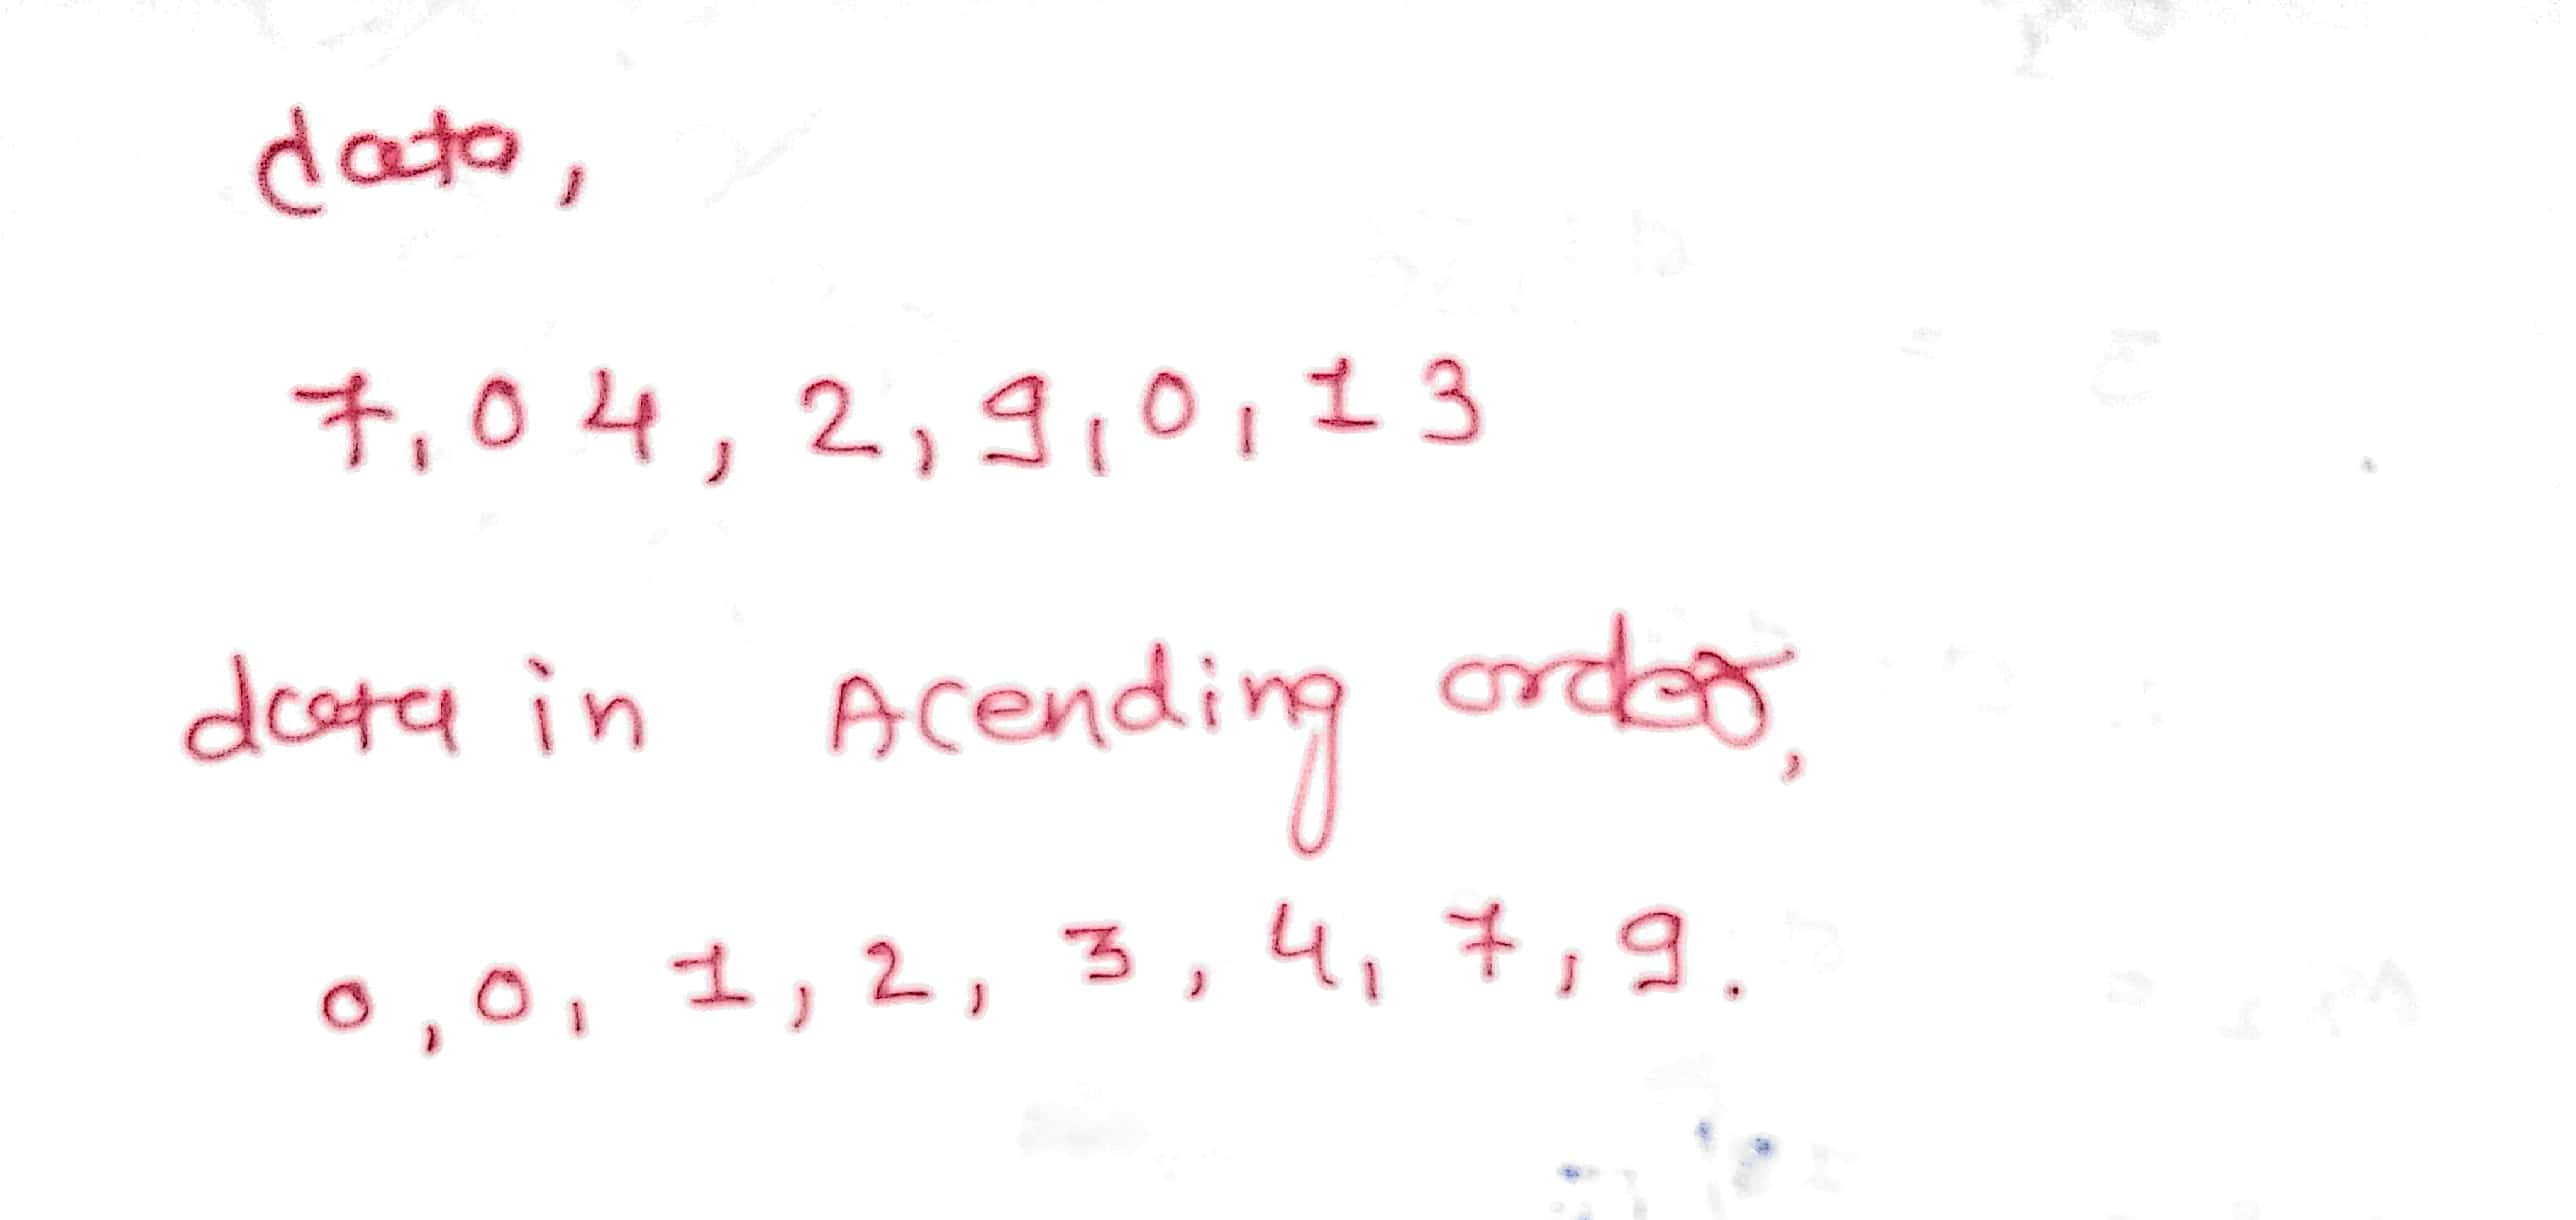
Transcribed Image Text:The following set of data is from a sample of n = 7.
7 0 4 2 9 0 13D
a. Compute the mean, median, and mode.
b. Compute the range, variance, standard deviation, and coefficient of variation.
c. Compute the Z scores. Are there any outliers?
d. Describe the shape of the data set.
a. Select the correct choice below and, if necessary, fill in the answer box to complete your
O A. The mean is
(Type an integer or a decimal. Do not round. Use a comma to separate answers as
B. There is no solution.
Help me solve this
View an example
Get more help -
Expert Solution
Step 1

Trending now
This is a popular solution!

Step by step
Solved in 3 steps with 2 images

Recommended textbooks for you
Glencoe Algebra 1, Student Edition, 9780079039897…
Algebra
ISBN:
9780079039897
Author:
Carter
Publisher:
McGraw Hill
Glencoe Algebra 1, Student Edition, 9780079039897…
Algebra
ISBN:
9780079039897
Author:
Carter
Publisher:
McGraw Hill