2. Sketch the scatter plot that shows: a. Positive correlation b. Negative correlation' c. Zero correlation
2. Sketch the scatter plot that shows: a. Positive correlation b. Negative correlation' c. Zero correlation

Glencoe Algebra 1, Student Edition, 9780079039897, 0079039898, 2018
18th Edition
ISBN:9780079039897
Author:Carter
Publisher:Carter
Chapter4: Equations Of Linear Functions
Section4.5: Correlation And Causation
Problem 15PPS

Related questions
Question
lt7 answer #2
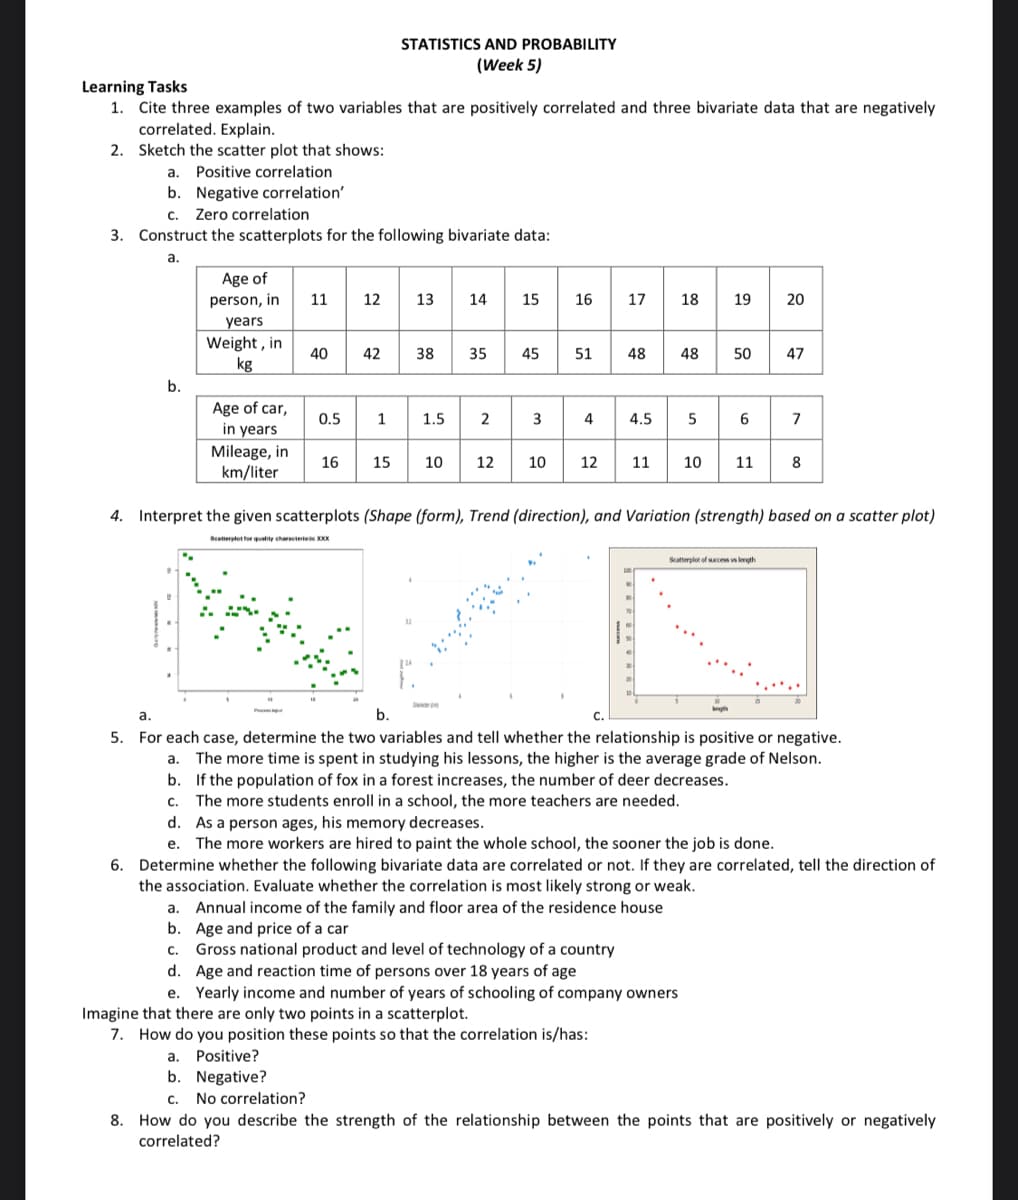
Transcribed Image Text:Learning Tasks
1. Cite three examples of two variables that are positively correlated and three bivariate data that are negatively
correlated. Explain.
2. Sketch the scatter plot that shows:
a. Positive correlation
b. Negative correlation'
C. Zero correlation
3. Construct the scatterplots for the following bivariate data:
a.
b.
Age of
person, in
years
Weight, in
kg
Age of car,
in years
Mileage, in
km/liter
11 12 13 14 15
40
STATISTICS AND PROBABILITY
(Week 5)
42
0.5 1
16
38
35
1.5 2
10
12
45
3
16 17 18 19 20
51 48
4
12
4.5
11
Imagine that there are only two points in a scatterplot.
7. How do you position these points so that the correlation is/has:
48
5
a. Annual income of the family and floor area of the residence house
b. Age and price of a car
c. Gross national product and level of technology of a country
d. Age and reaction time of persons over 18 years of age
e. Yearly income and number of years of schooling of company owners
50 47
6
10 11
4. Interpret the given scatterplots (Shape (form), Trend (direction), and Variation (strength) based on a scatter plot)
Scatterplot for quality characterisic XXX
Scatterplot of success vs length
7
8
a.
b.
5. For each case, determine the two variables and tell whether the relationship is positive or negative.
a. The more time is spent in studying his lessons, the higher is the average grade of Nelson.
b. If the population of fox in a forest increases, the number of deer decreases.
C. The more students enroll in a school, the more teachers are needed.
d. As a person ages, his memory decreases.
e. The more workers are hired to paint the whole school, the sooner the job is done.
6. Determine whether the following bivariate data are correlated or not. If they are correlated, tell the direction of
the association. Evaluate whether the correlation is most likely strong or weak.
a. Positive?
b. Negative?
C. No correlation?
8. How do you describe the strength of the relationship between the points that are positively or negatively
correlated?
Expert Solution
This question has been solved!
Explore an expertly crafted, step-by-step solution for a thorough understanding of key concepts.

This is a popular solution!

Trending now
This is a popular solution!

Step by step
Solved in 4 steps with 3 images

Recommended textbooks for you
Glencoe Algebra 1, Student Edition, 9780079039897…
Algebra
ISBN:
9780079039897
Author:
Carter
Publisher:
McGraw Hill

Big Ideas Math A Bridge To Success Algebra 1: Stu…
Algebra
ISBN:
9781680331141
Author:
HOUGHTON MIFFLIN HARCOURT
Publisher:
Houghton Mifflin Harcourt

Holt Mcdougal Larson Pre-algebra: Student Edition…
Algebra
ISBN:
9780547587776
Author:
HOLT MCDOUGAL
Publisher:
HOLT MCDOUGAL
Glencoe Algebra 1, Student Edition, 9780079039897…
Algebra
ISBN:
9780079039897
Author:
Carter
Publisher:
McGraw Hill
Big Ideas Math A Bridge To Success Algebra 1: Stu…
Algebra
ISBN:
9781680331141
Author:
HOUGHTON MIFFLIN HARCOURT
Publisher:
Houghton Mifflin Harcourt
Holt Mcdougal Larson Pre-algebra: Student Edition…
Algebra
ISBN:
9780547587776
Author:
HOLT MCDOUGAL
Publisher:
HOLT MCDOUGAL