2. Suppose, • C=0.8(1-t)Y • t=0.25 • | = 900 – 50i • G=800 a) What is the equation for IS curve b) What is the effect of increase in govt. expenditure by 100 on the IS equation & IS curve? Show the effect using graphs c)What will happen to the slope of IS curve if Investment becomes more sensitive tO interest, say = 900 – 60i ? -
2. Suppose, • C=0.8(1-t)Y • t=0.25 • | = 900 – 50i • G=800 a) What is the equation for IS curve b) What is the effect of increase in govt. expenditure by 100 on the IS equation & IS curve? Show the effect using graphs c)What will happen to the slope of IS curve if Investment becomes more sensitive tO interest, say = 900 – 60i ? -

Brief Principles of Macroeconomics (MindTap Course List)
8th Edition
ISBN:9781337091985
Author:N. Gregory Mankiw
Publisher:N. Gregory Mankiw
Chapter7: Production And Growth
Section: Chapter Questions
Problem 5CQQ

Related questions
Question
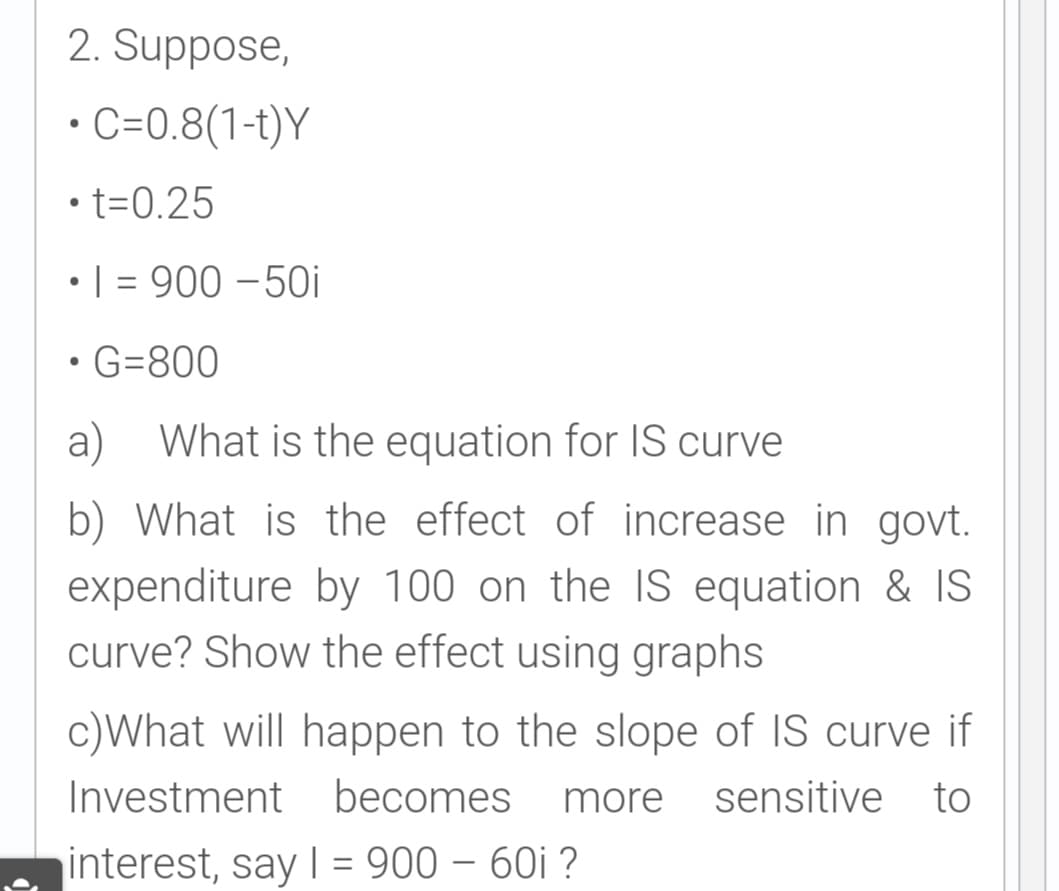
Transcribed Image Text:2. Suppose,
C=0.8(1-t)Y
• t=0.25
•| = 900 – 50i
• G=800
a)
What is the equation for lIS curve
b) What is the effect of increase in govt.
expenditure by 100 on the IS equation & IS
curve? Show the effect using graphs
c)What will happen to the slope of IS curve if
Investment becomes
more
sensitive to
interest, say | = 900 – 60i ?
Expert Solution
This question has been solved!
Explore an expertly crafted, step-by-step solution for a thorough understanding of key concepts.

This is a popular solution!

Trending now
This is a popular solution!

Step by step
Solved in 3 steps with 1 images

Knowledge Booster


Learn more about
Need a deep-dive on the concept behind this application? Look no further. Learn more about this topic, economics and related others by exploring similar questions and additional content below.Recommended textbooks for you
Brief Principles of Macroeconomics (MindTap Cours…
Economics
ISBN:
9781337091985
Author:
N. Gregory Mankiw
Publisher:
Cengage Learning

Essentials of Economics (MindTap Course List)
Economics
ISBN:
9781337091992
Author:
N. Gregory Mankiw
Publisher:
Cengage Learning
Brief Principles of Macroeconomics (MindTap Cours…
Economics
ISBN:
9781337091985
Author:
N. Gregory Mankiw
Publisher:
Cengage Learning
Essentials of Economics (MindTap Course List)
Economics
ISBN:
9781337091992
Author:
N. Gregory Mankiw
Publisher:
Cengage Learning