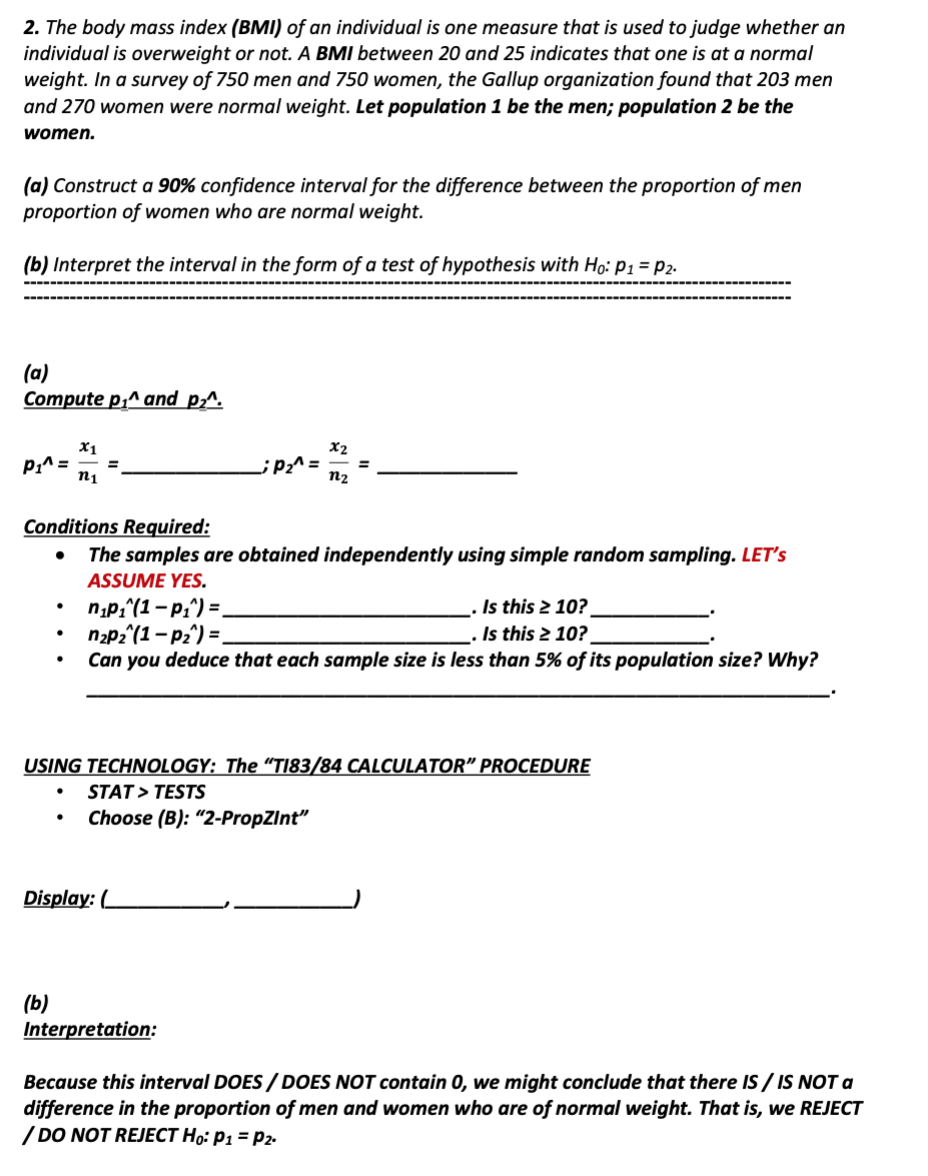
2. The body mass index (BMI) of an individual is one measure that is used to judge whether an individual is overweight or not. A BMI between 20 and 25 indicates that one is at a normal weight. In a survey of 750 men and 750 women, the Gallup organization found that 203 men and 270 women were normal weight. Let population 1 be the men; population 2 be the women. (a) Construct a 90% confidence interval for the difference between the proportion of men proportion of women who are normal weight. (b) Interpret the interval in the form of a test of hypothesis with Ho: p1 = P2- (a) Compute p,^ and p;^. X1 x2 P:^ = ;P²^= Conditions Required: The samples are obtained independently using simple random sampling. LET's ASSUME YES. n;p;^(1-p;^) =. n2p2^(1– p2^) =. Can you deduce that each sample size is less than 5% of its population size? Why? Is this 2 10? Is this 2 10? USING TECHNOLOGY: The “T|83/84 CALCULATOR" PROCEDURE STAT > TESTS Choose (B): “2-PropZlnt" Display: ( (b) Interpretation: Because this interval DOES /DOES NOT contain 0, we might conclude that there IS / IS NOT a difference in the proportion of men and women who are of normal weight. That is, we REJECT / DO NOT REJECT Họ: P1 = pP2-
2. The body mass index (BMI) of an individual is one measure that is used to judge whether an individual is overweight or not. A BMI between 20 and 25 indicates that one is at a normal weight. In a survey of 750 men and 750 women, the Gallup organization found that 203 men and 270 women were normal weight. Let population 1 be the men; population 2 be the women. (a) Construct a 90% confidence interval for the difference between the proportion of men proportion of women who are normal weight. (b) Interpret the interval in the form of a test of hypothesis with Ho: p1 = P2- (a) Compute p,^ and p;^. X1 x2 P:^ = ;P²^= Conditions Required: The samples are obtained independently using simple random sampling. LET's ASSUME YES. n;p;^(1-p;^) =. n2p2^(1– p2^) =. Can you deduce that each sample size is less than 5% of its population size? Why? Is this 2 10? Is this 2 10? USING TECHNOLOGY: The “T|83/84 CALCULATOR" PROCEDURE STAT > TESTS Choose (B): “2-PropZlnt" Display: ( (b) Interpretation: Because this interval DOES /DOES NOT contain 0, we might conclude that there IS / IS NOT a difference in the proportion of men and women who are of normal weight. That is, we REJECT / DO NOT REJECT Họ: P1 = pP2-
Glencoe Algebra 1, Student Edition, 9780079039897, 0079039898, 2018
18th Edition
ISBN:9780079039897
Author:Carter
Publisher:Carter
Chapter4: Equations Of Linear Functions
Section: Chapter Questions
Problem 8SGR
Related questions
Topic Video
Question

Transcribed Image Text:2. The body mass index (BMI) of an individual is one measure that is used to judge whether an
individual is overweight or not. A BMI between 20 and 25 indicates that one is at a normal
weight. In a survey of 750 men and 750 women, the Gallup organization found that 203 men
and 270 women were normal weight. Let population 1 be the men; population 2 be the
women.
(a) Construct a 90% confidence interval for the difference between the proportion of men
proportion of women who are normal weight.
(b) Interpret the interval in the form of a test of hypothesis with Ho: P1 = P2.
(a)
Compute p,^ and p;^.
X1
X2
P1^ =
n1
¿p^ =
%3D
n2
Conditions Required:
The samples are obtained independently using simple random sampling. LET's
ASSUME YES.
n;p¿^(1-p;^) =,
n¿p2^(1 – P2^) =
Can you deduce that each sample size is less than 5% of its population size? Why?
Is this 2 10?
Is this 2 10?
USING TECHNOLOGY: The “T|83/84 CALCULATOR" PROCEDURE
STAT > TESTS
Choose (B): “2-PropZInt"
Display: (
(b)
Interpretation:
Because this interval DOES/DOES NOT contain 0, we might conclude that there IS / IS NOT a
difference in the proportion of men and women who are of normal weight. That is, we REJECT
/ DO NOT REJECT Ho: P1 = p2-
Expert Solution
This question has been solved!
Explore an expertly crafted, step-by-step solution for a thorough understanding of key concepts.
This is a popular solution!
Trending now
This is a popular solution!
Step by step
Solved in 2 steps with 2 images

Knowledge Booster
Learn more about
Need a deep-dive on the concept behind this application? Look no further. Learn more about this topic, statistics and related others by exploring similar questions and additional content below.Recommended textbooks for you

Glencoe Algebra 1, Student Edition, 9780079039897…
Algebra
ISBN:
9780079039897
Author:
Carter
Publisher:
McGraw Hill

College Algebra (MindTap Course List)
Algebra
ISBN:
9781305652231
Author:
R. David Gustafson, Jeff Hughes
Publisher:
Cengage Learning

Glencoe Algebra 1, Student Edition, 9780079039897…
Algebra
ISBN:
9780079039897
Author:
Carter
Publisher:
McGraw Hill

College Algebra (MindTap Course List)
Algebra
ISBN:
9781305652231
Author:
R. David Gustafson, Jeff Hughes
Publisher:
Cengage Learning