2. The data below contains sale price, size, and land-to-building ratio for 10 large industrial properties {r} saleprice <- read.csv("https://www.siue.edu/~jpailde/saleprice.csv") saleprice i) Construct a scatterpot for sale price versus size and sale price versus land-to-building ratio`. Be sure to fit regression lines on the scatterplots. ii) Use the `Im function to estimated the equations of each regression model for sale price versus size` and `sale price versus land-to-building ratio`. iii) Check the error model assumption visually by constructing a residual plot and QQplot of the residuals for the two models. iv) Estimate the population regression slope of each model (line) by constructing 95\% confidence interval. Give a brief interpretation of the esimated slope in the context of the problem. v) Perform a hypothesis test on the regression slope of each model (line), use a 5\% level of significance. Given an appropriate conclusion.
2. The data below contains sale price, size, and land-to-building ratio for 10 large industrial properties {r} saleprice <- read.csv("https://www.siue.edu/~jpailde/saleprice.csv") saleprice i) Construct a scatterpot for sale price versus size and sale price versus land-to-building ratio`. Be sure to fit regression lines on the scatterplots. ii) Use the `Im function to estimated the equations of each regression model for sale price versus size` and `sale price versus land-to-building ratio`. iii) Check the error model assumption visually by constructing a residual plot and QQplot of the residuals for the two models. iv) Estimate the population regression slope of each model (line) by constructing 95\% confidence interval. Give a brief interpretation of the esimated slope in the context of the problem. v) Perform a hypothesis test on the regression slope of each model (line), use a 5\% level of significance. Given an appropriate conclusion.

MATLAB: An Introduction with Applications
6th Edition
ISBN:9781119256830
Author:Amos Gilat
Publisher:Amos Gilat
Chapter1: Starting With Matlab
Section: Chapter Questions
Problem 1P

Related questions
Question
Can you help me answer this using R code?
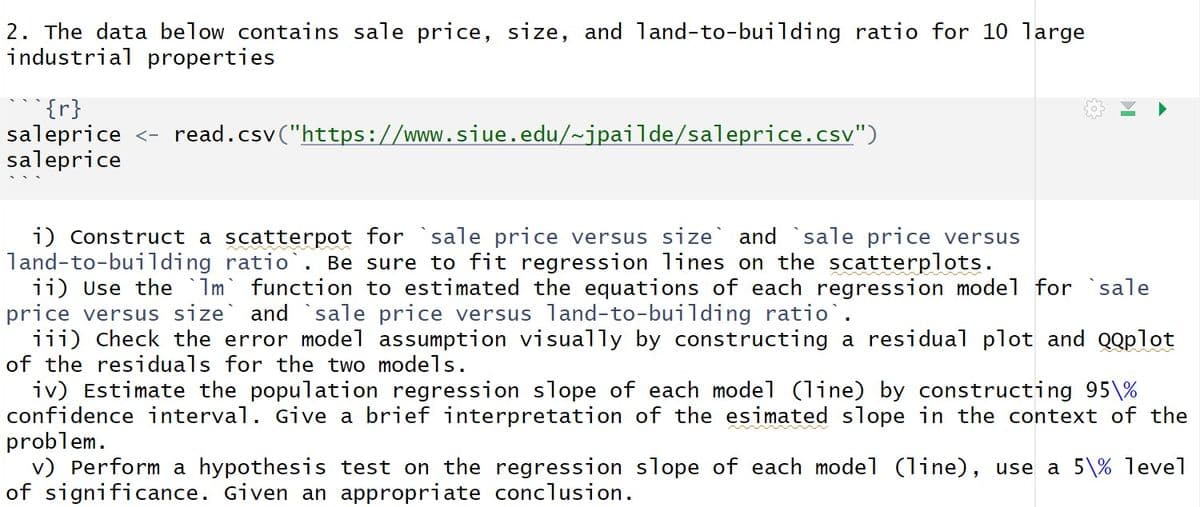
Transcribed Image Text:2. The data below contains sale price, size, and land-to-building ratio for 10 large
industrial properties
{r}
saleprice <- read.csv("https://www.siue.edu/~jpailde/saleprice.csv")
saleprice
i) Construct a scatterpot for sale price versus size and sale price versus
land-to-building ratio`. Be sure to fit regression lines on the scatterplots.
ii) Use the `Im function to estimated the equations of each regression model for sale
price versus size` and `sale price versus land-to-building ratio`.
iii) Check the error model assumption visually by constructing a residual plot and QQplot
of the residuals for the two models.
iv) Estimate the population regression slope of each model (line) by constructing 95\%
confidence interval. Give a brief interpretation of the esimated slope in the context of the
problem.
v) Perform a hypothesis test on the regression slope of each model (line), use a 5\% level
of significance. Given an appropriate conclusion.
Expert Solution
This question has been solved!
Explore an expertly crafted, step-by-step solution for a thorough understanding of key concepts.

Step by step
Solved in 2 steps with 5 images

Recommended textbooks for you
MATLAB: An Introduction with Applications
Statistics
ISBN:
9781119256830
Author:
Amos Gilat
Publisher:
John Wiley & Sons Inc

Probability and Statistics for Engineering and th…
Statistics
ISBN:
9781305251809
Author:
Jay L. Devore
Publisher:
Cengage Learning

Statistics for The Behavioral Sciences (MindTap C…
Statistics
ISBN:
9781305504912
Author:
Frederick J Gravetter, Larry B. Wallnau
Publisher:
Cengage Learning
MATLAB: An Introduction with Applications
Statistics
ISBN:
9781119256830
Author:
Amos Gilat
Publisher:
John Wiley & Sons Inc
Probability and Statistics for Engineering and th…
Statistics
ISBN:
9781305251809
Author:
Jay L. Devore
Publisher:
Cengage Learning
Statistics for The Behavioral Sciences (MindTap C…
Statistics
ISBN:
9781305504912
Author:
Frederick J Gravetter, Larry B. Wallnau
Publisher:
Cengage Learning

Elementary Statistics: Picturing the World (7th E…
Statistics
ISBN:
9780134683416
Author:
Ron Larson, Betsy Farber
Publisher:
PEARSON

The Basic Practice of Statistics
Statistics
ISBN:
9781319042578
Author:
David S. Moore, William I. Notz, Michael A. Fligner
Publisher:
W. H. Freeman

Introduction to the Practice of Statistics
Statistics
ISBN:
9781319013387
Author:
David S. Moore, George P. McCabe, Bruce A. Craig
Publisher:
W. H. Freeman