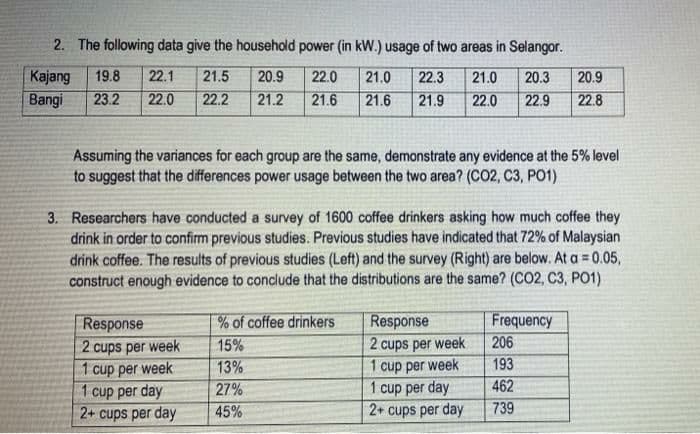
2. The following data give the household power (in kW.) usage of two areas in Selangor. 22.1 Kajang Bangi 19.8 21.5 20.9 22.0 21.0 22.3 21.0 20.3 20.9 23.2 22.0 22.2 21.2 21.6 21.6 21.9 22.0 22.9 22.8 Assuming the variances for each group are the same, demonstrate any evidence at the 5% level to suggest that the differences power usage between the two area? (CO2, C3, PO1)
2. The following data give the household power (in kW.) usage of two areas in Selangor. 22.1 Kajang Bangi 19.8 21.5 20.9 22.0 21.0 22.3 21.0 20.3 20.9 23.2 22.0 22.2 21.2 21.6 21.6 21.9 22.0 22.9 22.8 Assuming the variances for each group are the same, demonstrate any evidence at the 5% level to suggest that the differences power usage between the two area? (CO2, C3, PO1)

Glencoe Algebra 1, Student Edition, 9780079039897, 0079039898, 2018
18th Edition
ISBN:9780079039897
Author:Carter
Publisher:Carter
Chapter10: Statistics
Section10.4: Distributions Of Data
Problem 19PFA

Related questions
Question
2nd
Transcribed Image Text:2. The following data give the household power (in kW.) usage of two areas in Selangor.
Kajang
19.8
22.1
21.5
20.9
22.0
21.0
22.3
21.0
20.3
20.9
Bangi
23.2
22.0
22.2
21.2
21.6
21.6
21.9
22.0
22.9
22.8
Assuming the variances for each group are the same, demonstrate any evidence at the 5% level
to suggest that the differences power usage between the two area? (CO2, C3, PO1)
3. Researchers have conducted a survey of 1600 coffee drinkers asking how much coffee they
drink in order to confirm previous studies. Previous studies have indicated that 72% of Malaysian
drink coffee. The results of previous studies (Left) and the survey (Right) are below. At a = 0.05,
construct enough evidence to conclude that the distributions are the same? (CO2, C3, PO1)
Frequency
Response
2 cups per week
1 cup per week
1 cup per day
2+ cups per day
% of coffee drinkers
15%
13%
Response
2 cups per week
1 cup per week
1 cup per day
2+ cups per day
206
193
27%
462
45%
739
Expert Solution
This question has been solved!
Explore an expertly crafted, step-by-step solution for a thorough understanding of key concepts.

Step by step
Solved in 4 steps with 3 images

Recommended textbooks for you
Glencoe Algebra 1, Student Edition, 9780079039897…
Algebra
ISBN:
9780079039897
Author:
Carter
Publisher:
McGraw Hill
Glencoe Algebra 1, Student Edition, 9780079039897…
Algebra
ISBN:
9780079039897
Author:
Carter
Publisher:
McGraw Hill