dency ollowing data, which represent the daytime household temperature the thermostat is set to when someone is home for a random sample of 751 households. etermine the class midpoint, if necessary, for each class and approximate the mean and standard deviation temperature. E Click the icon to view the frequency distribution for the daytime household temperature. Class Class Midpoint 61-64 65-67 68-69 70 71-72 73–76 77-80 Round to one decimal place as needed.) he sample mean is 1°F. Round to one decimal place as needed.) he sample standard deviation is °F. Round to one decimal place as needed.)
dency ollowing data, which represent the daytime household temperature the thermostat is set to when someone is home for a random sample of 751 households. etermine the class midpoint, if necessary, for each class and approximate the mean and standard deviation temperature. E Click the icon to view the frequency distribution for the daytime household temperature. Class Class Midpoint 61-64 65-67 68-69 70 71-72 73–76 77-80 Round to one decimal place as needed.) he sample mean is 1°F. Round to one decimal place as needed.) he sample standard deviation is °F. Round to one decimal place as needed.)

Glencoe Algebra 1, Student Edition, 9780079039897, 0079039898, 2018
18th Edition
ISBN:9780079039897
Author:Carter
Publisher:Carter
Chapter10: Statistics
Section10.4: Distributions Of Data
Problem 19PFA

Related questions
Question
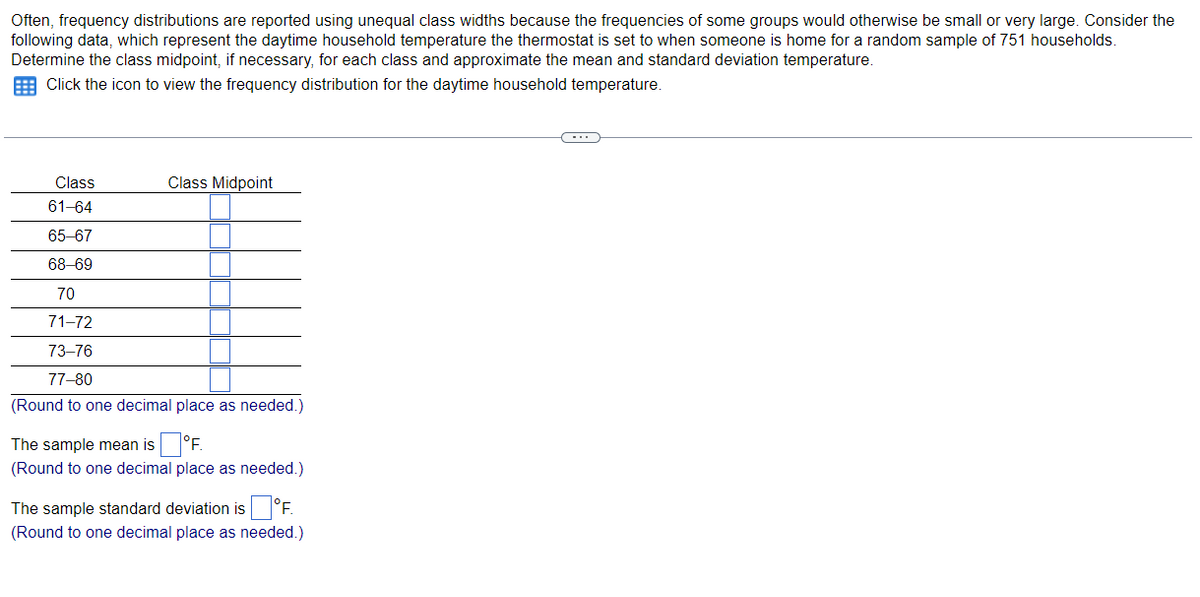
Transcribed Image Text:Often, frequency distributions are reported using unequal class widths because the frequencies of some groups would otherwise be small or very large. Consider the
following data, which represent the daytime household temperature the thermostat is set to when someone is home for a random sample of 751 households.
Determine the class midpoint, if necessary, for each class and approximate the mean and standard deviation temperature.
E Click the icon to view the frequency distribution for the daytime household temperature.
Class
Class Midpoint
61-64
65-67
68-69
70
71-72
73–76
77-80
(Round to one decimal place as needed.)
The sample mean is °F.
(Round to one decimal place as needed.)
The sample standard deviation is °F.
(Round to one decimal place as needed.)
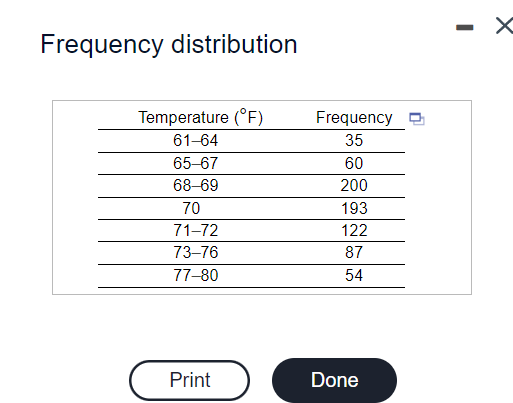
Transcribed Image Text:Frequency distribution
Temperature (°F)
Frequency O
61-64
35
65-67
60
68–69
200
70
193
71-72
122
73–76
87
77-80
54
Print
Done
Expert Solution
This question has been solved!
Explore an expertly crafted, step-by-step solution for a thorough understanding of key concepts.

Step by step
Solved in 2 steps with 2 images

Recommended textbooks for you
Glencoe Algebra 1, Student Edition, 9780079039897…
Algebra
ISBN:
9780079039897
Author:
Carter
Publisher:
McGraw Hill
Glencoe Algebra 1, Student Edition, 9780079039897…
Algebra
ISBN:
9780079039897
Author:
Carter
Publisher:
McGraw Hill