2. The following table shows the weights(?) to the nearest pound, heights(X) to the nearest inch, and ages(y) to the nearest year, of 12 boys 2: X: y: (i) (ii) (iii) 94 57 8 77 59 10 53 49 6 67 62 27 55 51 8 58 50 ㅋ ㅋㅋ 55 70 57 48 9 56 52 70 57 42 6 Find and plot the least-squares regression equation of Zon X and Y. Determine the estimated values of 7 from the given values of X and Y. Estimate the weight of a boy who is 9 years old and 54 inches tall. 76 67 12 68 57 9
2. The following table shows the weights(?) to the nearest pound, heights(X) to the nearest inch, and ages(y) to the nearest year, of 12 boys 2: X: y: (i) (ii) (iii) 94 57 8 77 59 10 53 49 6 67 62 27 55 51 8 58 50 ㅋ ㅋㅋ 55 70 57 48 9 56 52 70 57 42 6 Find and plot the least-squares regression equation of Zon X and Y. Determine the estimated values of 7 from the given values of X and Y. Estimate the weight of a boy who is 9 years old and 54 inches tall. 76 67 12 68 57 9

Linear Algebra: A Modern Introduction
4th Edition
ISBN:9781285463247
Author:David Poole
Publisher:David Poole
Chapter7: Distance And Approximation
Section7.3: Least Squares Approximation
Problem 31EQ

Related questions
Question
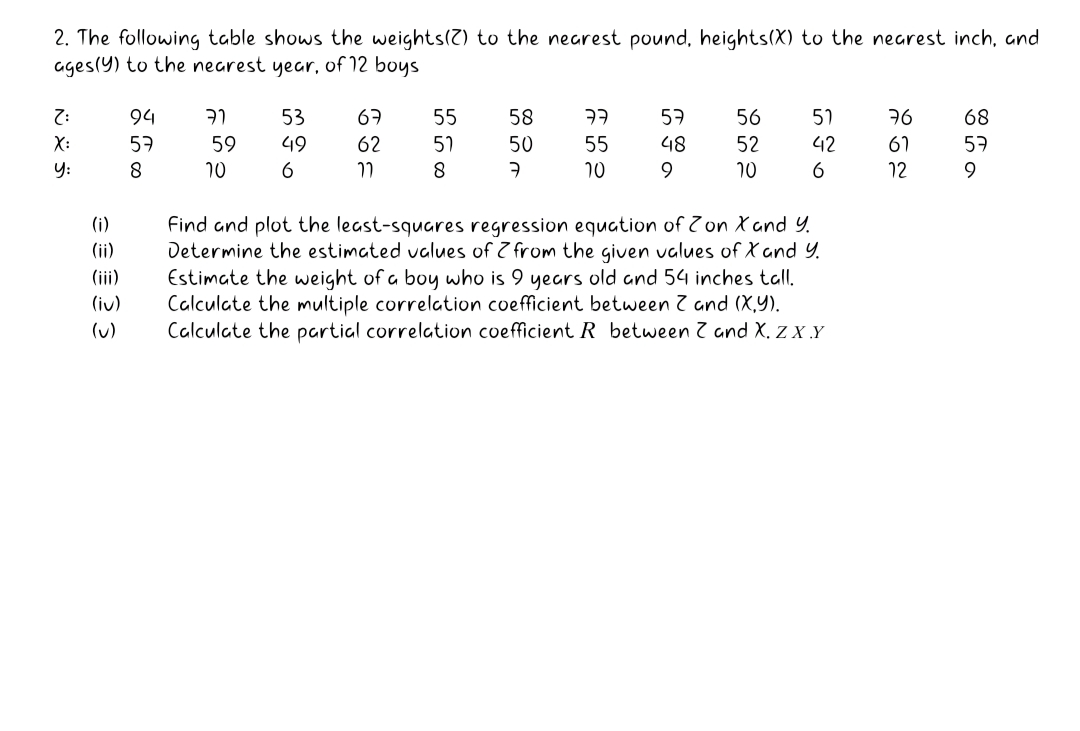
Transcribed Image Text:2. The following table shows the weights(7) to the nearest pound, heights(X) to the nearest inch, and
ages(Y) to the nearest year,
of 12 boys
:2
X:
94
53
67
55
58
57
56
57
76
68
57
59
62
51
50
55
52
42
61
57
y:
10
6
8.
10
9.
10
12
9.
Find and plot the least-squares regression equation of 7 on X and Y.
Determine the estimated values of 7 from the given ualues of X and Y.
Estimate the weight of a boy who is 9 years old and 54 inches tall.
Calculate the multiple correlation coefficient between 7 and (X,Y).
Calculate the partial correlation coefficient R between and X. z x .Y
(i)
(ii)
(iii)
(iv)
(u)
Expert Solution
This question has been solved!
Explore an expertly crafted, step-by-step solution for a thorough understanding of key concepts.

Step by step
Solved in 4 steps with 1 images

Recommended textbooks for you
Linear Algebra: A Modern Introduction
Algebra
ISBN:
9781285463247
Author:
David Poole
Publisher:
Cengage Learning

Glencoe Algebra 1, Student Edition, 9780079039897…
Algebra
ISBN:
9780079039897
Author:
Carter
Publisher:
McGraw Hill
Linear Algebra: A Modern Introduction
Algebra
ISBN:
9781285463247
Author:
David Poole
Publisher:
Cengage Learning
Glencoe Algebra 1, Student Edition, 9780079039897…
Algebra
ISBN:
9780079039897
Author:
Carter
Publisher:
McGraw Hill