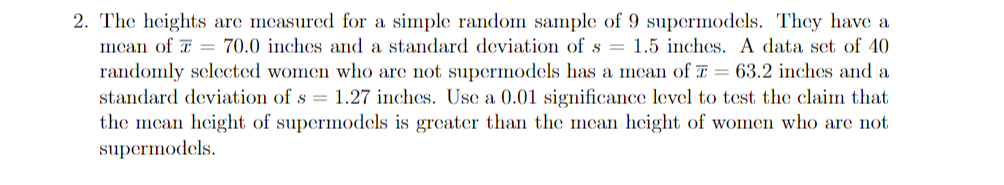
2. The heights are measured for a simple random sample of 9 supermodels. They have a mean of T = 70.0 inches and a standard deviation of s = 1.5 inches. A data set of 40 randomly selected women who are not supermodels has a mean of T = 63.2 inches and a standard deviation of s = 1.27 inches. Use a 0.01 significance level to test the claim that the mean height of supermodels is greater than the mean height of women who are not supermodels.
2. The heights are measured for a simple random sample of 9 supermodels. They have a mean of T = 70.0 inches and a standard deviation of s = 1.5 inches. A data set of 40 randomly selected women who are not supermodels has a mean of T = 63.2 inches and a standard deviation of s = 1.27 inches. Use a 0.01 significance level to test the claim that the mean height of supermodels is greater than the mean height of women who are not supermodels.

Glencoe Algebra 1, Student Edition, 9780079039897, 0079039898, 2018
18th Edition
ISBN:9780079039897
Author:Carter
Publisher:Carter
Chapter10: Statistics
Section10.4: Distributions Of Data
Problem 19PFA

Related questions
Question
I have 3 different answers for this and not sure which one is the correct one.
Transcribed Image Text:2. The heights are measured for a simple random sample of 9 supermodels. They have a
mcan of T = 70.0 inches and a standard deviation of s = 1.5 inches. A data set of 40
randomly selected women who are not supermodels has a mean of T = 63.2 inches and a
standard deviation of s = 1.27 inches. Use a 0.01 significance level to test the claim that
the mean height of supermodels is greater than the mean height of women who are not
supermodels.
Expert Solution
This question has been solved!
Explore an expertly crafted, step-by-step solution for a thorough understanding of key concepts.

This is a popular solution!

Trending now
This is a popular solution!

Step by step
Solved in 2 steps with 2 images

Recommended textbooks for you
Glencoe Algebra 1, Student Edition, 9780079039897…
Algebra
ISBN:
9780079039897
Author:
Carter
Publisher:
McGraw Hill
Glencoe Algebra 1, Student Edition, 9780079039897…
Algebra
ISBN:
9780079039897
Author:
Carter
Publisher:
McGraw Hill