Nationally, patients who go to the emergency room wait an average of 6 hours to be admitted into the hospital. Do patients at rural hospitals have a different waiting time? The 13 randomly selected patients who went to the emergency room at rural hospitals waited an average of 4.3 hours to be admitted into the hospital. The standard deviation for these 13 patients was 2.9 hours. What can be concluded at the the a = 0.01 level of significance level of significance? a. For this study, we should use Select an answer b. The null and alternative hypotheses would be: Hg: ?v Select an answer ♥ H: ?v Select an answer v C The test statistic ? v = (please show your answer to 3 decimal places.} d. The p-value = e. The p-value is 7v Q . Based on this, we should Setect an answer v the null hypothesis. 8 Thus, the final conclusion is that. (Piease show your answer to 4 decimal places.) O The data suggest that the population mean awaiting time to be admitted into the hospital from the emergency room for patients atrural hospitals is not significantly different from 6 hours at a = 0.01, so there is statistically insignificant evidence to conclude that the population mean waiting time to be admittedinto the hospital from the emergency room for patients at rural hospitals is different from 6 hours. O The data suggest the population mean is not significantly different from 6 ata = 0.01, so there is statistically insignificant evidence to conclude that the population mean waiting time to be admitted into the hospital from the emergency room for patients at rural hospitais is equal to 6 hours. O The data suggest the populaton mean is significantly different from 6 at a = 0.01, 50 there is statistically significant evidence to conclude that the population mean waiting time to be admitted into the hospital from the emergency room for patients at rural hospitals is different from 6 hours.
Nationally, patients who go to the emergency room wait an average of 6 hours to be admitted into the hospital. Do patients at rural hospitals have a different waiting time? The 13 randomly selected patients who went to the emergency room at rural hospitals waited an average of 4.3 hours to be admitted into the hospital. The standard deviation for these 13 patients was 2.9 hours. What can be concluded at the the a = 0.01 level of significance level of significance? a. For this study, we should use Select an answer b. The null and alternative hypotheses would be: Hg: ?v Select an answer ♥ H: ?v Select an answer v C The test statistic ? v = (please show your answer to 3 decimal places.} d. The p-value = e. The p-value is 7v Q . Based on this, we should Setect an answer v the null hypothesis. 8 Thus, the final conclusion is that. (Piease show your answer to 4 decimal places.) O The data suggest that the population mean awaiting time to be admitted into the hospital from the emergency room for patients atrural hospitals is not significantly different from 6 hours at a = 0.01, so there is statistically insignificant evidence to conclude that the population mean waiting time to be admittedinto the hospital from the emergency room for patients at rural hospitals is different from 6 hours. O The data suggest the population mean is not significantly different from 6 ata = 0.01, so there is statistically insignificant evidence to conclude that the population mean waiting time to be admitted into the hospital from the emergency room for patients at rural hospitais is equal to 6 hours. O The data suggest the populaton mean is significantly different from 6 at a = 0.01, 50 there is statistically significant evidence to conclude that the population mean waiting time to be admitted into the hospital from the emergency room for patients at rural hospitals is different from 6 hours.

MATLAB: An Introduction with Applications
6th Edition
ISBN:9781119256830
Author:Amos Gilat
Publisher:Amos Gilat
Chapter1: Starting With Matlab
Section: Chapter Questions
Problem 1P

Related questions
Topic Video
Question
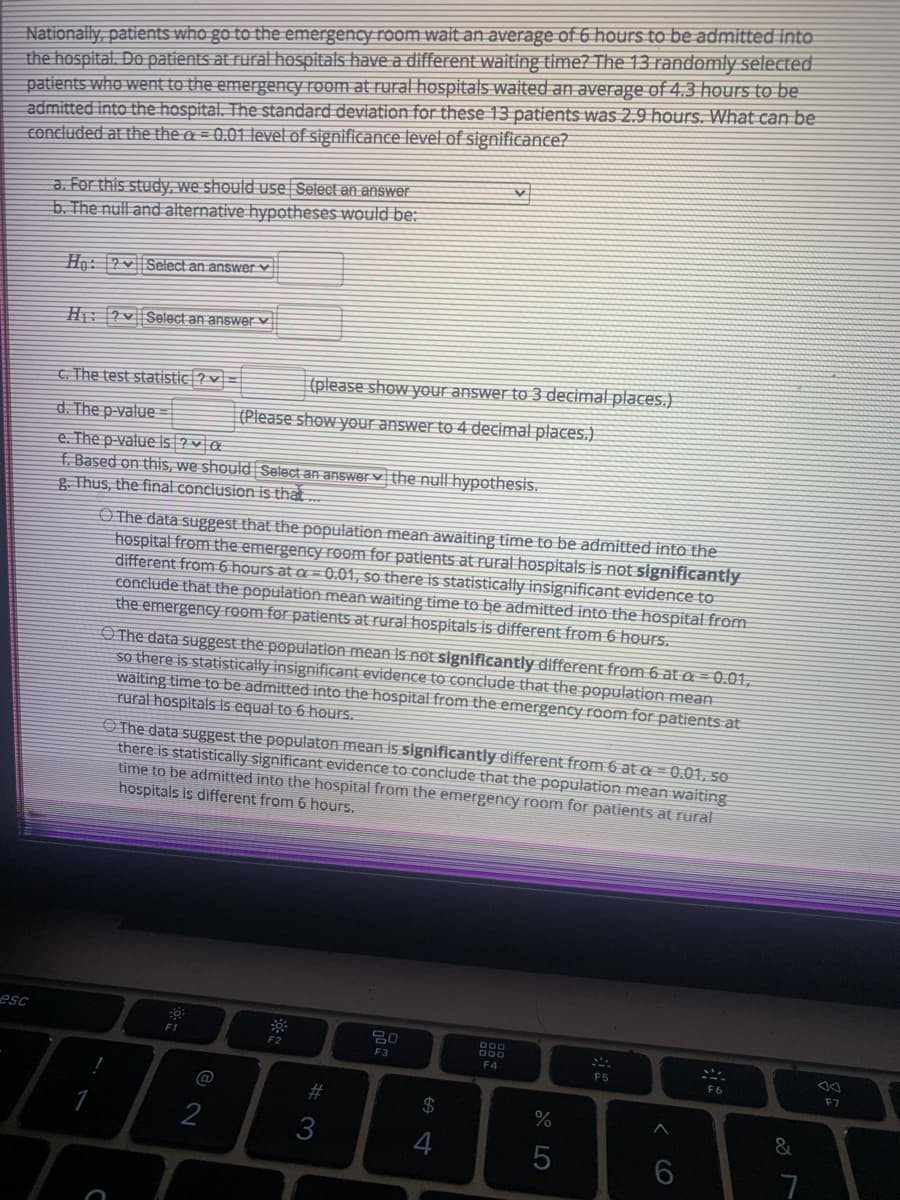
Transcribed Image Text:Nationally, patients who go to the emergency room wait an average of 6 hours to be admitted into
the hospital. Do patients at rural hospitals have a different waiting time? The 13 randomly selected
patients who went to the emergenty room at rural hospitals waited an average of 4.3 hours to be
admitted into the hospital. The standard deviation for these 13 patients was 2,9 hours. What can be
concluded at the the a = 0.01 level of significance level of significance?
a. For this study, we should use Select an answer
b. The null and alternative hypotheses would be:
Hạ: ?v Select an answer
H: ?v Select an answer v
C. The test statistic ? v =
(please show your answer to 3 decimal places.)
d. The p-value =
(Please show your answer to 4 decimal places.)
e. The p-value s ? v a
. Based on this, we should Select an answer v the null hypothesis.
g. Thus, the final conclusion is that.
O The data suggest that the population mean awaiting time to be admitted into the
hospital from the emergency room for patients at rural hospitals is not significantly
different from 6 hours at a = 0.01, so there is statistically insignificant evidence to
conclude that the population mean waiting time to be admitted into the hospital from
the emergency room for patients at rural hospitals is different from 6 hours.
O The data suggest the population mean Is not significantly different from 6 at a = 0.01,
so there is statistically insignificant evidence t conclude that the population mean
waiting time to be admitted into the hospital from the emergency room for patients atE
rural hospitals is equal to 6 hours.
O The data suggest the populaton mean is significantly different from 6 at a = 0.01, so
there is statistically significant evidence to conclude that the population mean waiting
time to be admitted into the hospital from the emergency room for patients at rural
hospitals is different from 6 hours.
esc
00
F1
F3
F4
F5
F6
F7
%23
24
2
3
Expert Solution
This question has been solved!
Explore an expertly crafted, step-by-step solution for a thorough understanding of key concepts.

This is a popular solution!

Trending now
This is a popular solution!

Step by step
Solved in 4 steps

Knowledge Booster


Learn more about
Need a deep-dive on the concept behind this application? Look no further. Learn more about this topic, statistics and related others by exploring similar questions and additional content below.Recommended textbooks for you
MATLAB: An Introduction with Applications
Statistics
ISBN:
9781119256830
Author:
Amos Gilat
Publisher:
John Wiley & Sons Inc

Probability and Statistics for Engineering and th…
Statistics
ISBN:
9781305251809
Author:
Jay L. Devore
Publisher:
Cengage Learning

Statistics for The Behavioral Sciences (MindTap C…
Statistics
ISBN:
9781305504912
Author:
Frederick J Gravetter, Larry B. Wallnau
Publisher:
Cengage Learning
MATLAB: An Introduction with Applications
Statistics
ISBN:
9781119256830
Author:
Amos Gilat
Publisher:
John Wiley & Sons Inc
Probability and Statistics for Engineering and th…
Statistics
ISBN:
9781305251809
Author:
Jay L. Devore
Publisher:
Cengage Learning
Statistics for The Behavioral Sciences (MindTap C…
Statistics
ISBN:
9781305504912
Author:
Frederick J Gravetter, Larry B. Wallnau
Publisher:
Cengage Learning

Elementary Statistics: Picturing the World (7th E…
Statistics
ISBN:
9780134683416
Author:
Ron Larson, Betsy Farber
Publisher:
PEARSON

The Basic Practice of Statistics
Statistics
ISBN:
9781319042578
Author:
David S. Moore, William I. Notz, Michael A. Fligner
Publisher:
W. H. Freeman

Introduction to the Practice of Statistics
Statistics
ISBN:
9781319013387
Author:
David S. Moore, George P. McCabe, Bruce A. Craig
Publisher:
W. H. Freeman