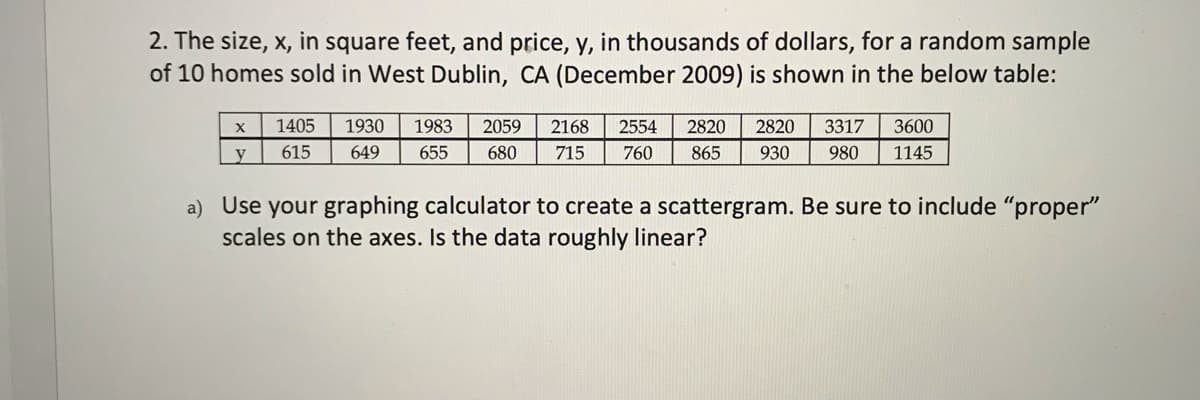
2. The size, x, in square feet, and price, y, in thousands of dollars, for a random sample of 10 homes sold in West Dublin, CA (December 2009) is shown in the below table: 1405 1930 1983 2059 2168 2554 2820 2820 3317 3600 y 615 649 655 680 715 760 865 930 980 1145 a) Use your graphing calculator to create a scattergram. Be sure to include "proper" scales on the axes. Is the data roughly linear?
2. The size, x, in square feet, and price, y, in thousands of dollars, for a random sample of 10 homes sold in West Dublin, CA (December 2009) is shown in the below table: 1405 1930 1983 2059 2168 2554 2820 2820 3317 3600 y 615 649 655 680 715 760 865 930 980 1145 a) Use your graphing calculator to create a scattergram. Be sure to include "proper" scales on the axes. Is the data roughly linear?

Holt Mcdougal Larson Pre-algebra: Student Edition 2012
1st Edition
ISBN:9780547587776
Author:HOLT MCDOUGAL
Publisher:HOLT MCDOUGAL
Chapter11: Data Analysis And Probability
Section11.5: Interpreting Data
Problem 1C

Related questions
Question
100%
HELP PLEASE!!!
Thank you :)
Transcribed Image Text:2. The size, x, in square feet, and price, y, in thousands of dollars, for a random sample
of 10 homes sold in West Dublin, CA (December 2009) is shown in the below table:
1405
1930
1983
2059
2168
2554
2820
2820
3317
3600
y
615
649
655
680
715
760
865
930
980
1145
a) Use your graphing calculator to create a scattergram. Be sure to include "proper"
scales on the axes. Is the data roughly linear?
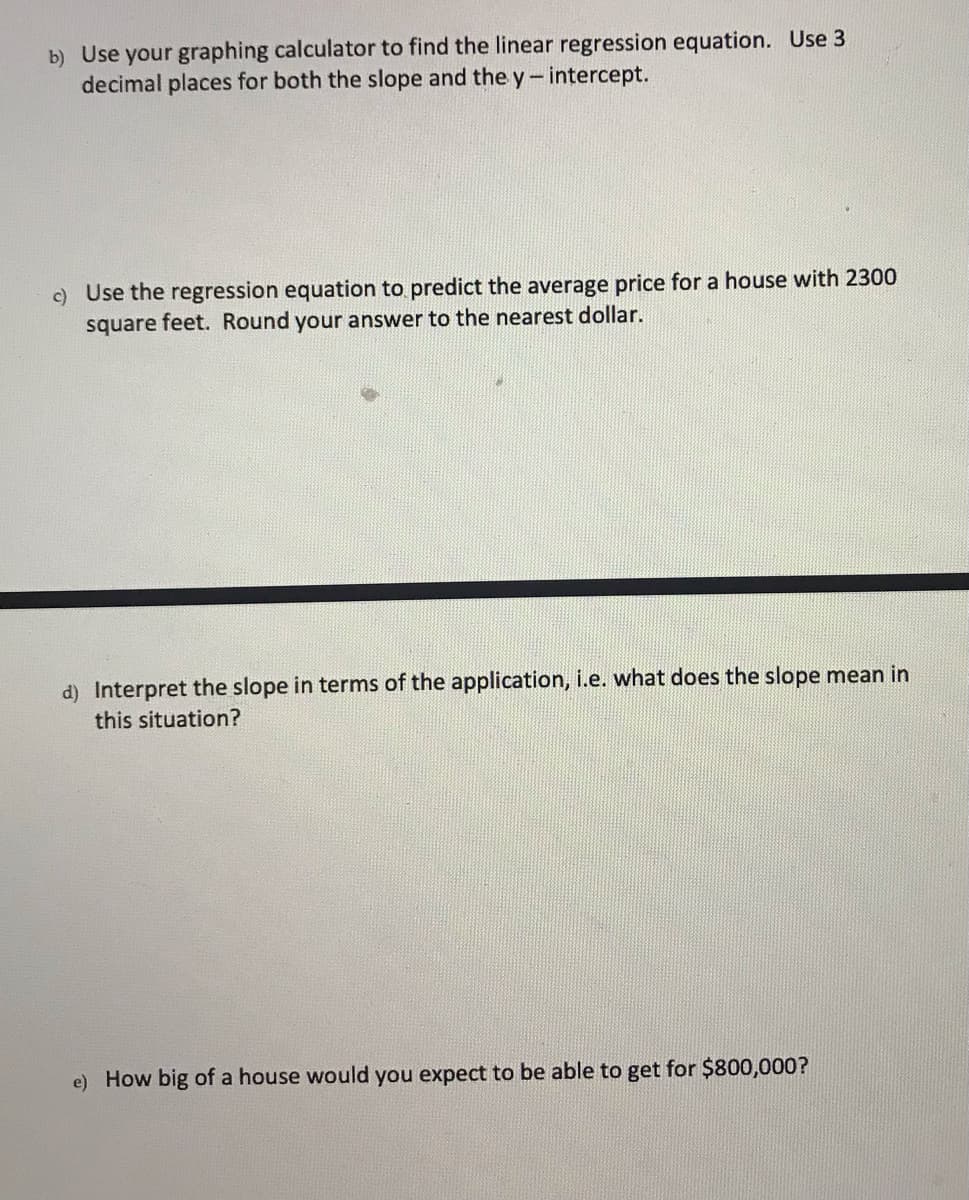
Transcribed Image Text:b) Use your graphing calculator to find the linear regression equation. Use 3
decimal places for both the slope and the y-intercept.
c) Use the regression equation to predict the average price for a house with 2300
square feet. Round your answer to the nearest dollar.
d) Interpret the slope in terms of the application, i.e. what does the slope mean in
this situation?
e) How big of a house would you expect to be able to get for $800,000?
Expert Solution
This question has been solved!
Explore an expertly crafted, step-by-step solution for a thorough understanding of key concepts.

This is a popular solution!

Trending now
This is a popular solution!

Step by step
Solved in 3 steps with 3 images

Recommended textbooks for you
Holt Mcdougal Larson Pre-algebra: Student Edition…
Algebra
ISBN:
9780547587776
Author:
HOLT MCDOUGAL
Publisher:
HOLT MCDOUGAL

Glencoe Algebra 1, Student Edition, 9780079039897…
Algebra
ISBN:
9780079039897
Author:
Carter
Publisher:
McGraw Hill
Holt Mcdougal Larson Pre-algebra: Student Edition…
Algebra
ISBN:
9780547587776
Author:
HOLT MCDOUGAL
Publisher:
HOLT MCDOUGAL
Glencoe Algebra 1, Student Edition, 9780079039897…
Algebra
ISBN:
9780079039897
Author:
Carter
Publisher:
McGraw Hill