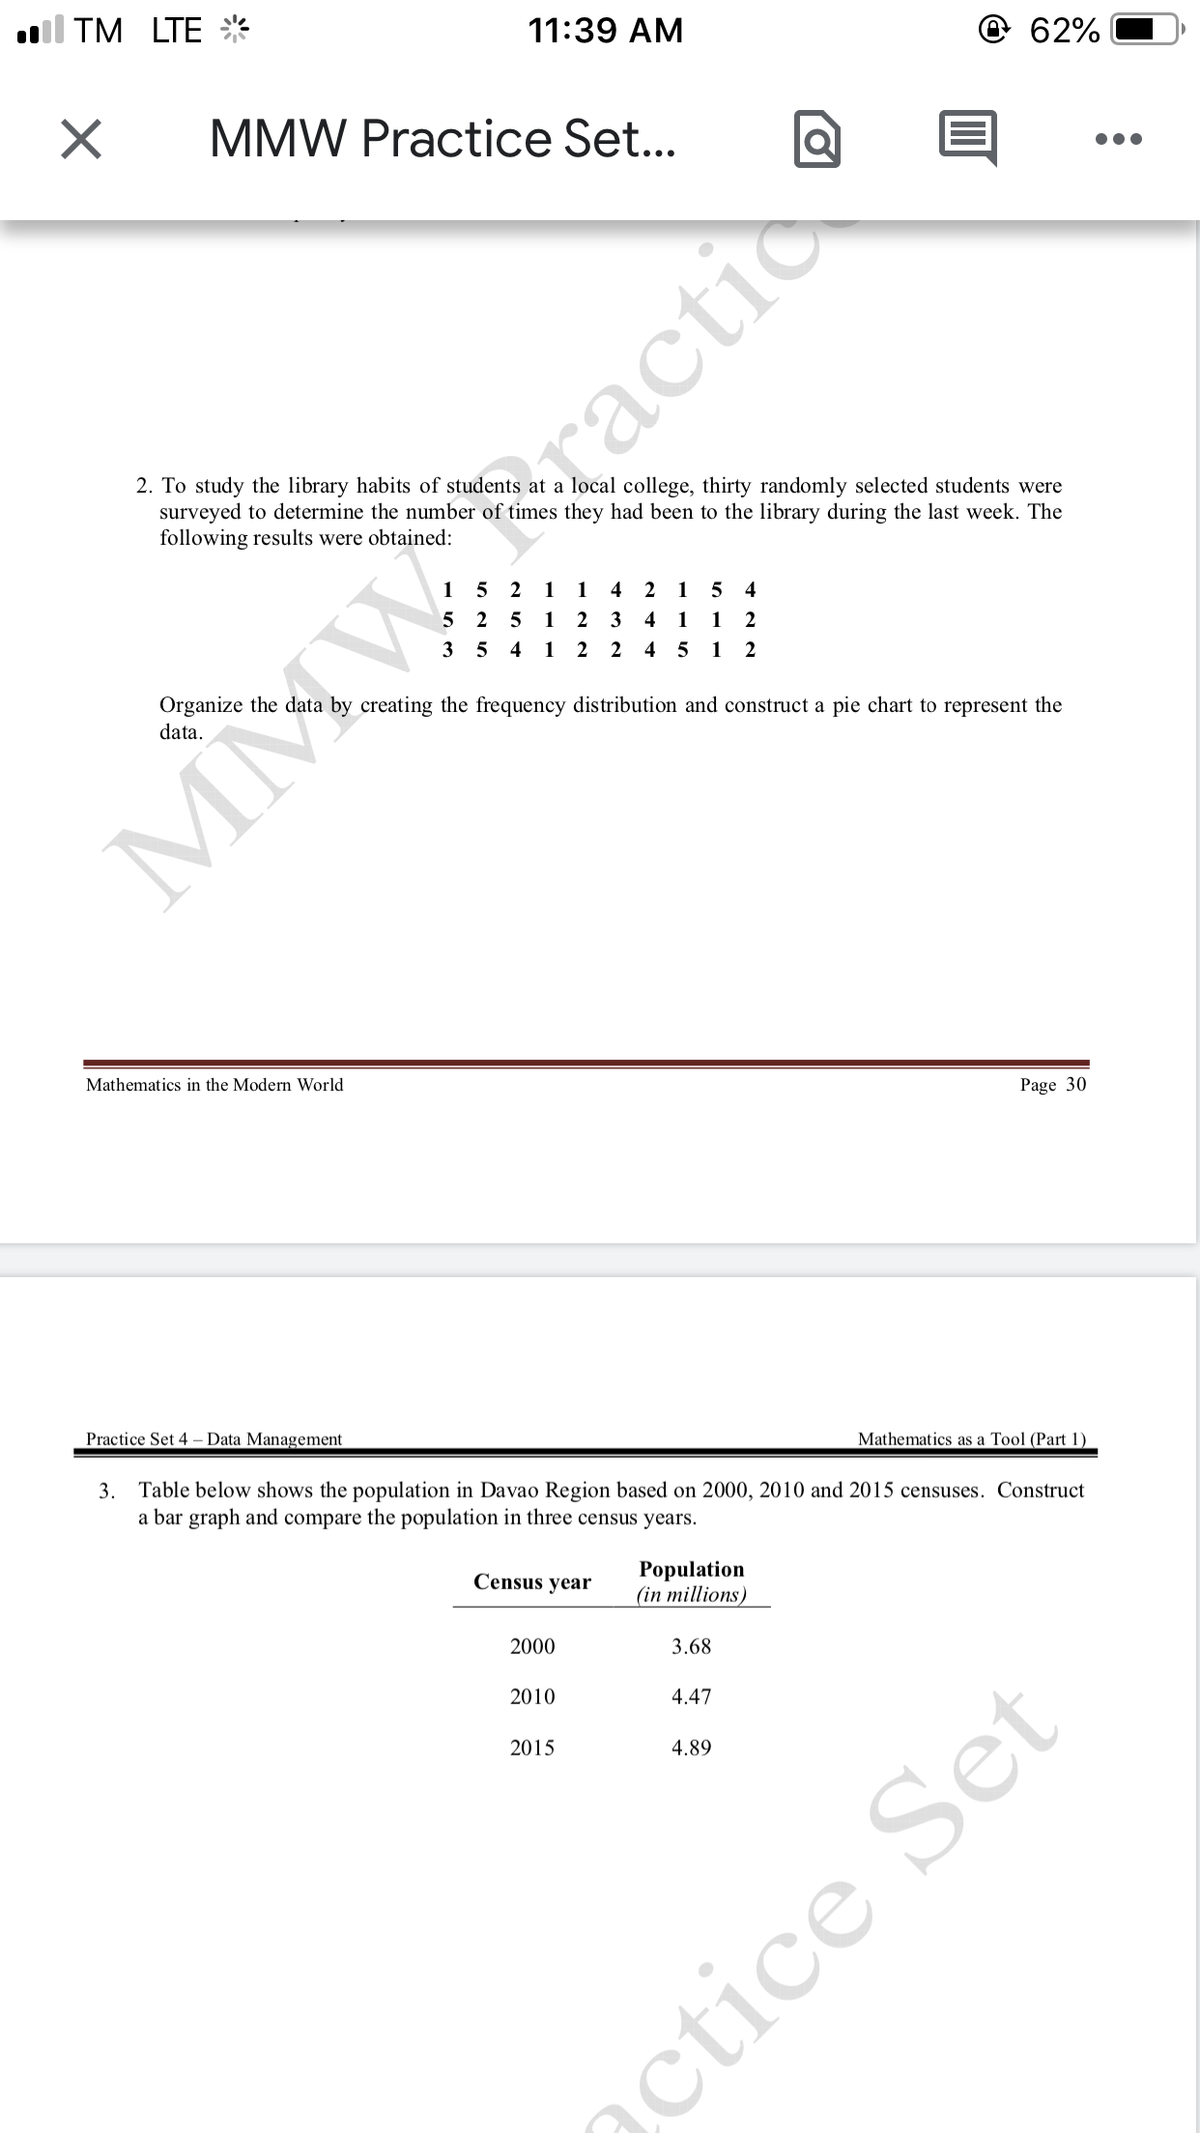
2. To study the library habits of students at a local college, thirty randomly selected students were surveyed to determine the number of times they had been to the library during the last week. The following results were obtained: 15 2 1 4 2 1 5 4 3 4 1 1 2 1 5 2 5 1 2 3 5 4 1 2 2 4 5 1 2 Organize the data by creating the frequency distribution and construct a pie chart to represent the data.
2. To study the library habits of students at a local college, thirty randomly selected students were surveyed to determine the number of times they had been to the library during the last week. The following results were obtained: 15 2 1 4 2 1 5 4 3 4 1 1 2 1 5 2 5 1 2 3 5 4 1 2 2 4 5 1 2 Organize the data by creating the frequency distribution and construct a pie chart to represent the data.

Glencoe Algebra 1, Student Edition, 9780079039897, 0079039898, 2018
18th Edition
ISBN:9780079039897
Author:Carter
Publisher:Carter
Chapter10: Statistics
Section10.6: Summarizing Categorical Data
Problem 4BGP

Related questions
Question
Transcribed Image Text:al TM LTE
11:39 AM
@62%
MMW Practice Set...
•..
2. To study the library habits of students at a local college, thirty randomly selected students were
surveyed to determine the number of times they had been to the library during the last week. The
following results were obtained:
1
5 2
1
1
4
1
4
2
1
2
3
4
1
1
2
3
4
1
2
4
1
Organize the data by creating the frequency distribution and construct a pie chart to represent the
data.
MMW
Mathematics in the Modern World
Page 30
Practice Set 4 – Data Management
Mathematics as a Tool (Part 1)
3. Table below shows the population in Davao Region based on 2000, 2010 and 2015 censuses. Construct
a bar graph and compare the population in three census years.
Population
(in millions)
Census year
2000
3.68
2010
4.47
2015
4.89
actice Set
dractio
Expert Solution
This question has been solved!
Explore an expertly crafted, step-by-step solution for a thorough understanding of key concepts.

This is a popular solution!

Trending now
This is a popular solution!

Step by step
Solved in 2 steps with 2 images

Knowledge Booster


Learn more about
Need a deep-dive on the concept behind this application? Look no further. Learn more about this topic, probability and related others by exploring similar questions and additional content below.Recommended textbooks for you
Glencoe Algebra 1, Student Edition, 9780079039897…
Algebra
ISBN:
9780079039897
Author:
Carter
Publisher:
McGraw Hill
Glencoe Algebra 1, Student Edition, 9780079039897…
Algebra
ISBN:
9780079039897
Author:
Carter
Publisher:
McGraw Hill