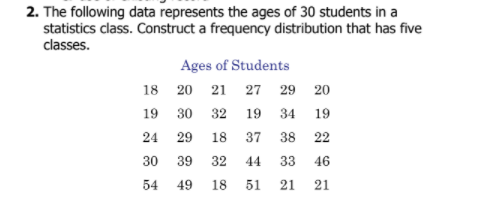
2. The following data represents the ages of 30 students in a statistics class. Construct a frequency distribution that has five classes. Ages of Students 18 20 21 27 29 20 19 30 32 19 34 19 24 29 18 37 38 22 30 39 32 44 33 46 54 49 18 51 21 21
Q: 5. Find the rank correlation for the following distribution. Marks in Economics 48 60 72 62 56 40 39…
A: The marks of the Economics and Accountancy are following: Marks in Economics Marks in Accountancy…
Q: The following data represents the ages of 30 students in a statist class. Construct a frequency…
A: Class width:
Q: The following represent the student's grades of a statistics class: 23 60 79 32 57 74 52 70 82 36 80…
A: Class limits: These are the two endpoints of a class interval used for tally marking the given…
Q: The following table gives the final marks of a sample of first year statistics students. 32 34 44…
A:
Q: Examine the frequency distribution. Plant Height (inches) Frequency 8–11 2 12–15 6 16–19 11 20–23…
A: The width of a class in a frequency distribution is the difference between the upper and lower class…
Q: The following table gives the final marks of a sample of first year statistics students. 32 34 44 48…
A: (a) The class frequency distribution table is as follows Class Frequency Relative frequency…
Q: Given the money spent on books for the spring semester, create a Frequency distribution table (No…
A: Steps to create the frequency distribution; Here we are given that the number of classes is 6. From…
Q: 1- Following is the number of emergency calls made in 35 consecutive days by an ambulance server…
A: The representation of frequency distribution has two ways. one is tabular form, another method is…
Q: The following table shows the ages of competitors in a charity tennis event in Rome:Age…
A: The number of times each variety occurs in known as frequency. A classification showing different…
Q: 45 70 60 52 66 67 62 54 61 51 72 75 87 57 85 66 66 74 81 65 41 78 55 68 66…
A: Since you have posted a question with multiple sub-parts, we will solve first three subparts for…
Q: Suppose that 50 students are enrolled in a statistics class and the following are the test scores…
A: Relative frequency: The relative frequency is obtained by dividing each frequency by the total…
Q: III. The data represent the ages of Presidents at the time they were first inaugurated. 57 61 57 57…
A: A histogram is used to understand the distribution of the data. In a histogram, the x-axis values…
Q: A social psychologist is interested in finding out whether people who self-identify as shy are more…
A: Given information: Significance value α=0.01 The given information can be summarized in the…
Q: The following data represents the age of 30 lottery winners. 24 27 28 31 35 39 40 48 49 55 56 57 57…
A: A frequency distribution is a list, table or graph that displays the frequency of various outcomes…
Q: Consider the following data set. The annual wages of employees at a small accounting firm are given…
A: Solution: The given data set is 25, 25, 30, 30, 35, 35, 50, 60, 16, 14, 18, 18 and 20.
Q: 3. Construct a Grouped Frequency Distribution on the data below 19 61 58 28 19 21 33 63 27 20 22 26…
A: Let there be k=6 number of classes. Then,Width=Largest value-Smallest valuek=76-186≃10
Q: Cicero Manufacturing Inc. produced the following number of products in the week between Christmas…
A: Given data: 27 27 27 28 27 25 25 28 26 28 26 28 31 30 26 26 To organize the data into a frequency…
Q: 2. Given a frequency distribution of a sample of college students in Marymount College was asked how…
A: The median is the middlemost data point in a dataset provided the dataset is arranged in an orderly…
Q: Construct X and R charts for the following data: Sample Number Observations 1 32 37 42 28 32 40 3 39…
A:
Q: Consider the following frequency table representing the distribution of hours students watch tv in a…
A: Given Data: Class Frequency 17-24 4 25-32 12 33-40 7 41-48 7 49-56 7
Q: CONSTRUCT THE FREQUENCY DISTRIBUTION TABLE OF THE FOLLOWING DATA AND MAKE A BAR CHART AND HISTOGRAM.…
A: To create the frequency table, we create class Intervals according the above data set. Then count…
Q: 4. The following data is the scores of forty students in a 100-item math quiz. 65 75 83 92 83 90 59…
A: The question is based on a freq. dist. of data and graphical representation of data Given data :
Q: Given a Statistics class of 27 students, the number of minutes each student spent per day doing…
A:
Q: Construct a Histogram for the following frequency distribution of the heights of 100 male students…
A: Given Height (inches) No. of students 60-62 5 63-65 18 66-68 42 69-71 27 72-74 8
Q: What is the total number of observations in the following frequency distribution table? Quiz Score…
A:
Q: Listed by state are the percentages of the population who have completed 4 or more years of a…
A: Given data…
Q: 3. Listed below are the speeds from 30 random speeding tickets in Denver over the last week. Create…
A: Provided information is; number of observations(N) = 30 Given data is ; 48 92 50 29 40 129 43 108…
Q: The following table represents a grouped frequency distribution of the number of hours spent…
A: The following table represents a grouped frequency distribution of the number of hours spent…
Q: Here is a sample of checks from the Metro Diner from this past week: $57 $102 $59 $58 $77 $55…
A: Since we only answer up to 3 sub-parts, we’ll answer the first 3. Please resubmit the question and…
Q: Thirty-five soccer players were challenged to do as many sit-ups as possible in two minutes. Here…
A: We have to construct frequency distribution for mentioned data First we will arrange data. Than we…
Q: Build the frequency distribution table with 5 classes, and for the following observations for some…
A: One of the critical tasks of statistics is to organize and represent data. The ability to organize…
Q: at the Twentieth Century Electronics Company for a sample of 2 45 52 48 41 56 46 44 42 48 53 51 53…
A: “Since you have posted a question with multiple sub-parts, we will solve first three subparts for…
Q: Below are the scores of 20 students in a 50-item statistics quiz: 35 42 25 29 38 39 49 41 28 26 26…
A: Solution-: The scores of 20 students in a 50-item statistics quiz: 35, 42, 25, 29, 38, 39, 49, 41,…
Q: 2- The ages of the Vice Presidents of the United States at the time of their death are listed below.…
A:
Q: Marks for a university business statistics class are given in the following table. 63 74 42 65 51 54…
A: Since you have posted a question with multiple sub-parts, we will solve first three sub-parts for…
Q: 3. Construct a Grouped Frequency Distribution on the data below 19 61 21 33 26 36 31 58 28 19 20 22…
A:
Q: 2. The accessory choices of 143 people are recorded in the table. wearing a watch no watch wearing a…
A: Relative Frequency: A Relative frequency is the proportion of the number of times a value of the…
Q: Consider the following information about the payroll of NBA teams. The data is in millions of…
A: Since you have posted a question with multiple sub-parts, we will solve first three sub-parts for…
Q: Consider the ages of 18 employees in a fast-food chain: 46 37 45 52 56 26 25 47 55 29 40 31 50 33…
A: From the above data We are given that the Consider the ages of 18 employees in a fast-food chain: 46…
Q: The following are final grades (in terms of percentages) from a class of 20 students. 70 75 70 84 90…
A: Arrange the data in ascending order as follows:
Q: The food services division of Mikumi National park restaurant is studying the amount families who…
A: (a). Construct a frequency distribution for the given data: The data represents the amount spent in…
Q: 4. Suppose you are given the following table showing the relationship between church attendance and…
A: Hello! As you have posted more than 3 sub parts, we are answering the first 3 sub-parts. In case…
Q: Consider the ages of 18 faculty members in Mathematics Department. 56 33 37 40 52 50 45 26 46 29 25…
A: Hello. Since you have asked multiple questions, we will solve the first question for you. If you…
Q: Use the following table to answer Questions 11 – 14. The numbers represent the points scored in 20…
A: Frequency Distribution: In Statistical theory, a frequency distribution is a tabular, listed or…
Q: The following data represents the age of 30 lottery winners. 21 27 32 32 33 34 35 40 40 42 43 44 44…
A: From the provided information, The data represents the 30 lottery winners which are as follow: 21,…
Q: Use the following Frequency table to calculate the median. Class Frequency 2……4 4…
A: Class Interval Frequency, f Cumulative Frequency 2-4 4 4 5-7 6 10 8-10 3 13 11-13 2 15…
Q: III. The data represent the ages of Presidents at the time they were first inaugurated. 57 61 57 57…
A: g) According to the provided information, the age of the youngest President is 46. 46 is the…
Q: Construct the frequency distribution table,
A: The given data is of 50 students are enrolled in a statistics class and the test scores received by…
Q: Build the frequency distribution table with 5 classes, and for the following observations for some…
A: Since you have asked multiple questions, we will solve the first question for you. If you want any…
Q: Complete the frequency distribution for the data. Age Frequency 20-29 30-39 40-49 50-59…
A:
Trending now
This is a popular solution!
Step by step
Solved in 2 steps with 2 images