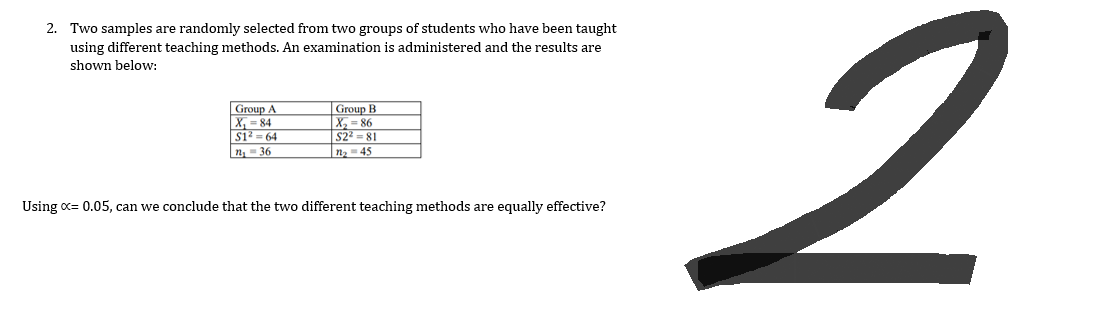
2. Two samples are randomly selected from two groups of students who have been taught using different teaching methods. An examination is administered and the results are shown below: Group A X-84 S1²=64 1₂-36 Group B X₂=86 S2²=81 n₂ = 45 Using x= 0.05, can we conclude that the two different teaching methods are equally effective?


Q: 4. Suppose that Y₁, Y₂, ..., Y is a random sample of size m from Gamma (a = 3,ß = 0), where 0 is not…
A: Given Y1,Y2,..,Yn be the random sample
Q: 5. The grade point average (GPA) for college students is based on a weighted mean computation. For…
A: Weighted mean is given by,x̄w = ΣXi*wi/Σwi Where wi's are the weightage. Here, wi: 9, 15, 33, 3 Xi:…
Q: A formal hypothesis test is to be conducted to test the claim that the wait times at the Space…
A: For the given statement Given that μ =44
Q: 2. The Department of Trade and Industry reported that the mean retail price per gallon of a certain…
A: LetX: the retail price price per gallon.X has a bell shaped disribution with mean(μ)=140.5 PhP…
Q: The number of streetlights in a town is growing linearly. Four months ago (t = 0) there were 47…
A: It is given that, four months ago t=0 there were 47 lights. and now t=4 there are 107 lights.
Q: Page 3 of 5 3. Construct the graphs below using the table provided. Frequency 2 5 6 1 Class…
A: Given information: Class boundaries Frequency 39.5 to 44.5 2 44.5 to 49.5 5 49.5 to 54.5 6…
Q: The following data were collected by counting the number of operating rooms in use at Tampa General…
A:
Q: A television show conducted an experiment to study what happens when buttered toast is dropped on…
A: The question is about hypo. testing Given : Total no. of buttered slices ( n ) = 42 No. of slices…
Q: The data represent the number of driving fatalities for a certain area by age for male and female…
A: The given table: Total number of females = 14401 Total number of females who are age of 21-34 is…
Q: Please help me do this case study with explanations with the answers and the calculations on excel…
A: The customers' ratings of the product have mean μ=80. The ratings have a standard deviation σ=25.…
Q: 2. ) Find the items asked below. Answer with 2 places to the right of the decimal if necessary.…
A: As per our guidelines we suppose to answer only three sub parts. Given data is85 , 88, 84, 83, 83,…
Q: b. Fill in the following two-way frequency table for the data. Month 1 Month 2 Total Store 1 Store 2…
A: Given: Chart is given where transactions of three stores are given for 2 months
Q: Find the outliers in the following data set: 3, -5,2,2, 13.5, 6, 3,7. Find (a) Q₁-(1.5)(1QR) = (b)…
A:
Q: A test to determine whether a certain antibody is present is 99.6% effective. This means that the…
A: Given that When antibody is not present Probability that test is negative=0.996 Probability that…
Q: Find the probability distribution for the number of spades.
A: We know that There are 52 cards in the deck divided into two colour i.e red(26) and black (26).…
Q: A population grows according to an exponential growth model. The initial population is Po = 5, and…
A: It is given that the initial population is P0=5 and the growth rate is r=0.3.
Q: Two random variables X and Y have a joint probability density function 3 fxy(x, y) = 16 fo 0 a) Find…
A:
Q: The claim is that weights (grams) of quarters made after 1964 have a mean equal to 5.670 g as…
A: From the provided information, Sample size (n) = 37 Test statistic (t) = -2.706 Level of…
Q: 1. Write down the econometric model that this OLS regression estimates 2. Interpret the belavg…
A: Hi, there! Since you have posted a question with multiple sub-parts, we will solve first three…
Q: Claim: More than 4.4% of homes have only a landline telephone and no wireless phone. Sample data: A…
A: given data claim : more than 4.4% of homes have only a landline telephhone. n = 13342 p⏞ = 0.0581…
Q: Given that the means of x and y are 64 and 66 , their standard deviations are 2.8 and 3.2…
A: Answer: From the given data, mean of X is X- = 64 mean of Y is Y- = 66 Standard deviation of x is σx…
Q: You flip a biased coin (P(H) = 0.56) until you get a heads. The random variable X records the number…
A: It is given that the probability of head on flipping a biased coin is P(H) = 0.56.
Q: As the standard deviation increases A) The scores in the data set will become more different than…
A: We have to Given in above question, Standard deviations increases
Q: In the following Python commands, what does the 0.99 represent? import scipy.stats as st…
A: given Python command is import scipy.stats as stst.norm.interval(0.99, 0.50, 0.05)
Q: The probability that a randomly selected person has high blood pressure (the event H) is P(H) = 0.4…
A: GivenThe probability that a randomly selected person has high blood pressure (the event H) is P(H) =…
Q: Consider the following exponential probability density function. a. Which of the following is the…
A: X has exponential distribution and probability density function of X isf(x)=12e-x2 for x≥0
Q: The Empirical Rule states that we can expect 95% of all z-scores to be in the range of A) z = -.05…
A: Ans#- The Empirical Rule states that we can expect 95% of all z-scores to be in the range of…
Q: 15 a random sample From Gamma (a=3, B =), where Check whether or not. Suppose that Y., Y.,.. Size M…
A:
Q: K In a survey of a group of men, the heights in the 20-29 age group were normally distributed, with…
A: Given that, in a survey of a group of men, the heights were normally distributed with mean 68.6…
Q: 1. A foundation, that aims to help families that were struck by natural disasters, conducted a fund-…
A: Given that We have to find mean, median and mode:
Q: Disease Control to determine heal ge students, college students were wear a seat belt when riding in…
A: According to guidelines we solve first three subparts when given multiple subparts.
Q: A drug tester claims that a drug cures a rare skin disease 66% of the time. The claim is checked by…
A:
Q: A population of beetles are growing according to a linear growth model. The initial population (week…
A: We have given that P0 = 3 P4 = 43 We have to find explicit formula for beetle population after n…
Q: The amount of time (minutes) a sample of students spent on online social media in a 4-hour window is…
A: Given data is Class Interval Frequency 0 to <10 5 10 to <20 13 20 to <30 16 30…
Q: The variance in a production process is an important measure of the quality of the process. A large…
A: Given: n1 = 25 n2 = 22 α = 0.05 Formula Used: Test-statistic F = s12s22
Q: A sample of 100 provided a sample mean of 77.5. The population standard deviation is known to be 15.…
A: It is given that Population mean, μ = 80 Sample mean, x̄ = 77.5 Population standard deviation, σ =…
Q: 1.128 Find an SAT percentile. Reports on a student's ACT or SAT results usually give the percentile…
A: Suppose a random variable X, defines the SAT scores of a student.
Q: Find the variance and standard deviation of the following probability distributions. X P(X) X*P(X)…
A: Given that: X P(X) 1 14 2 18 3 18 4 12
Q: Suppose a plywood from a supplier are suspected to contain 2% that are below specifications. One…
A:
Q: P(E)=enter your response here (Type an integer or a decimal. Do not round.)
A:
Q: 5. Suppose that a random sample X₁, X2, X20 follows an exponential distribution with parameter B.…
A:
Q: You and nine of your classmates are attending an event. How many ways can you be arranged in a…
A: You and nine of your classmates are attending an event.so total number of classmates =10
Q: 20% of adults in the particular community have at least a bachelors degree. Suppose X is a binomial,…
A: It is given X is defined as the number of adults with at least a bachelors degree.
Q: Claim: The standard deviation of pulse rates of adult males is less than 10 bpm. For a random sample…
A: given data : claim: σ<10 bpmsample size(n) = 157sample standard deviation (s) = 8.8 bpmvalue of…
Q: Find the lower boundary of the 90% confidence interval for the variance of the ages of seniors at…
A: Given information: n=24 s=2.04 Confidence interval for variance: n-1s2χ1-α2,n-12≤σ2≤n-1s2χα2,n-12
Q: A survey of 100 companies shows that 75 of them have installed wireless local area network (WLANS)…
A:
Q: a. How many class intervals were used in the histogram? OE b. How many students wrote midterm exam?…
A: class frequency 10-15 1 15-20 3 20-25 0 25-30 24 30-35 28 35-40 19 40-45 25
Q: The following data set represents the population densities per square mile of land area in 15 states…
A: Given The data is as follows: 1,19,35,43,49,55,63,94,105,110,175,231,239,351,738
Q: If a stock is selected at random, what is the probability it paid dividend?
A: It is given that Number of stocks paid dividend = 40 + 75 = 115 Total = 40+75+87+48 = 250
Q: what is the probability that all three are defective? (b) If four items arrive in succession, what…
A: It is given that P( defective ) = p = 20% = 0.20 Here, we have parameter p = 0.20 and n ( different…
FOLLOW THE INSTRUCTIONS AND ANSWER COMPLETELY AND TYPEWRITTEN FOR UPVOTE.
NOT FOLLOWING MY INSTRUCTIONS GETS DOWNVOTE


Trending now
This is a popular solution!

Step by step
Solved in 2 steps

- Suppose a study was conducted to compare the sleep deprivation rates of Californians and Oregonians. The proportion of California residents who reported insufficient rest or sleep during each of the preceding 30 days is 8.8%, while this proportion is 7% for Oregon residents. These data are based on simple random samples of 1,545 California and 1,460 Oregon adult residents. a) Conduct a hypothesis test to determine if these data provide strong evidence the rate of sleep deprivation is different for the two states. Use California as Group A and Oregon as Group B.Test statistic (Round to 4 decimal places): p-value (round to 4 decimal places): Conclusion at the 5% level of significance: We accept the null hypothesis. We reject the null hypothesis. We fail to reject the null hypothesis. b) It is possible the conclusion of the test in part (a) is incorrect (contradicts with the reality). If this is the case, what type of error was made? Type I Error Type III Error Type II Error A…Let p1 and p2 be the respective proportions of women with iron-deficiency anemia in each of two developing countries. A random sample of 1900 women from the first country yielded 513 women with iron-deficiency anemia, and an independently chosen, random sample of 1700 women from the second country yielded 515 women with iron-deficiency anemia. Can we conclude, at the 0.10 level of significance, that the proportion of women with anemia in the first country is less than the proportion of women with anemia in the second country? Perform a one-tailed test. Then complete the parts below.Carry your intermediate computations to three or more decimal places and round your answers as specified in the parts below. a. State the null hypothesis H0 and the alternative hypothesis H1. b. Find the values of the test statistic. c. FInd the p-value. d. Can we conclude that the proportion of women with anemia in the first country is less than the proportion of women with anemia in the second country?1) A cement producer, manufactures and then fills 40kg-bags of powder cement on twodistinct production tracks located in separate suburbs. To determine whether differencesexist between the average fill rates for the two tracks, a random sample of 25 bags fromTrack 1 and a random sample of 16 bags from Track 2 were recently selected. Each bag’sweight was measured and the following information measures from the samples arereported:Production ProductionTrack 1 Track 2n1 = 25 n2 = 16x2 = 40.02 x1 = 39.87 s1 = 0.59 s2 = 0.88 Supervision believes that the fill rates of the two tracks are normally distributed with equalvariances.Construct a 95% confidence interval estimate of the true mean difference between the twotracks.--------------------------------------------------------------------------------------------------------------2) Two independent simple random samples were selected from two normallydistributed populations with unequal variances yielded the following information:Sample 1…
- The contingency table shows the result of a random sample of students by Ziyi Zhang at PCC and the number of hours they spend investing on Robinhood and Acorns by age and gender. At alpha =0.05, can you conclude that age is related to gender when it comes to time spent investing on Robinhood and Acorns. GENDER 16-20yrs 21-30yrs 31-40yrs 41-50yrs 51-60yrs 61yrs or older Male 45 170 90 72 45 26 Female 9 30 21 17 10 5 What is the Chi-square test statistics and the decision for this question. The Test statistics is . Leave your answer in 3 decimal places. DECISION: We the null hypothesis.A poll reported that 63% of adults were satisfied with the job the major airlines were doing. Suppose 20 adults are selected at random and the number who are satisfied is recorded. Would it be unusual to find more than 17 who are satisfied with the job the major airlines were doing? The result is/is not unusual, because P(x>17) = _____under the assumption that the proportion of adults that are satisfied with the airlines is 63%. Thus, in 100 random samples of size 20, this result is expected in about ______ of the random samples. (Type integers or decimals. Round to four decimal places as needed.)A potato chip company produces a large number of potato chip bags each day and wants to investigate whether a new packaging machine will lower the proportion of bags that are damaged. The company selected a random sample of 150 bags from the old machine and found that 15 percent of the bags were damaged, then selected a random sample of 200 bags from the new machine and found that 8 percent were damaged. Let pˆOp^O represent the sample proportion of bags packaged on the old machine that are damaged, pˆNp^N represent the sample proportion of bags packaged on the new machine that are damaged, pˆCp^C represent the combined proportion of damaged bags from both machines, and nOnO and nNnN represent the respective sample sizes for the old machine and new machine. Have the conditions for statistical inference for testing a difference in population proportions been met? No, the condition for independence has not been met, because random samples were not selected. A No, the…
