2. Using EXCEL or Google sheets, what is the correlation coefficient for this data? a. 0.934 b. 0.818 C. 0.987 d. -0.802 SAOR 3-A Ans. 3. Using EXCEL or Google sheets, what is the equation for the best fit line for this data? a. ŷ= 0.397x + 0.243 b. y = 0.548x-1.693 C. y = 0.643x - 1.321 d. ŷ= -0.397x +.732 Ans. 4. Using EXCEL or Google sheets, what percent of the variation for this data can be explained by using the linear model found above? a. 97.46% b. 67% C. 50% d. 87.3%
2. Using EXCEL or Google sheets, what is the correlation coefficient for this data? a. 0.934 b. 0.818 C. 0.987 d. -0.802 SAOR 3-A Ans. 3. Using EXCEL or Google sheets, what is the equation for the best fit line for this data? a. ŷ= 0.397x + 0.243 b. y = 0.548x-1.693 C. y = 0.643x - 1.321 d. ŷ= -0.397x +.732 Ans. 4. Using EXCEL or Google sheets, what percent of the variation for this data can be explained by using the linear model found above? a. 97.46% b. 67% C. 50% d. 87.3%

Glencoe Algebra 1, Student Edition, 9780079039897, 0079039898, 2018
18th Edition
ISBN:9780079039897
Author:Carter
Publisher:Carter
Chapter4: Equations Of Linear Functions
Section4.5: Correlation And Causation
Problem 11PPS

Related questions
Question
Help me solve questions 2-4 please using the following data
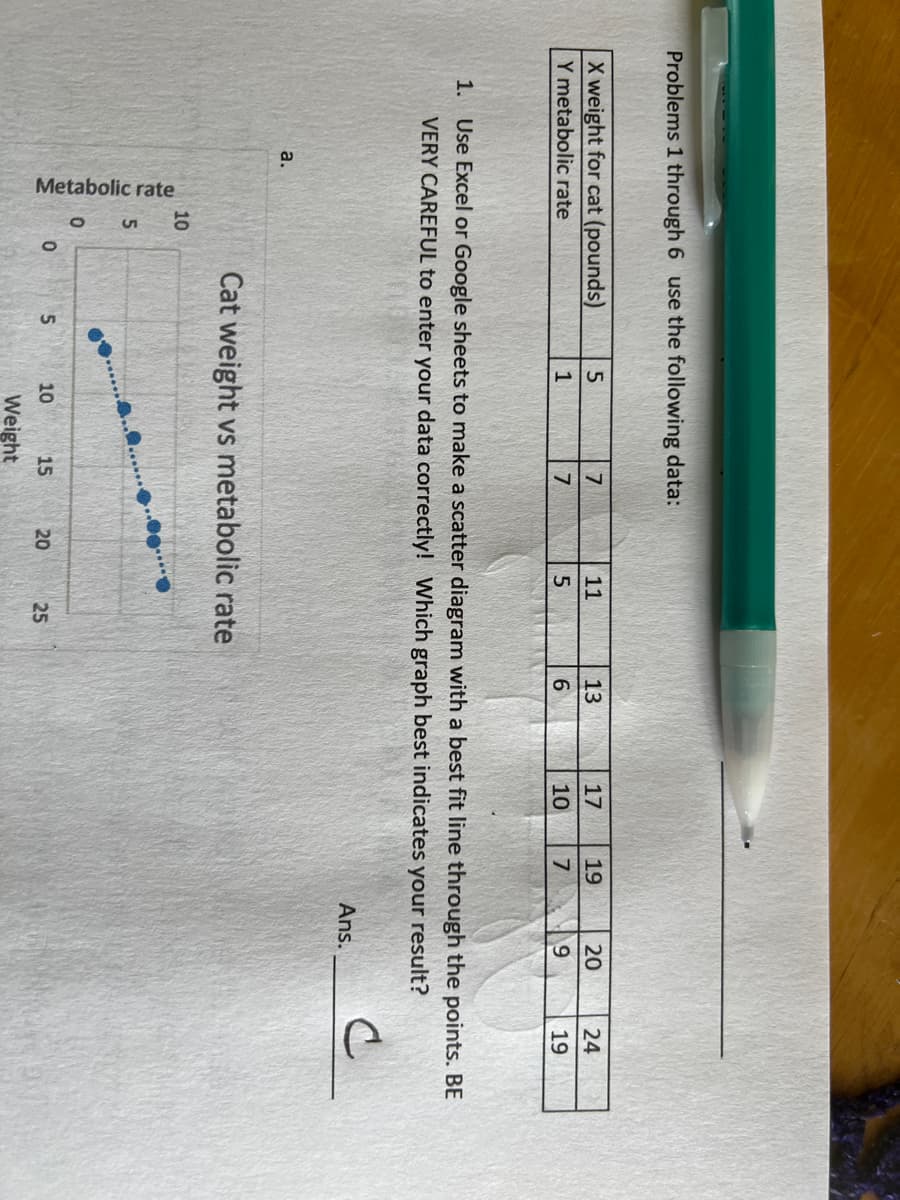
Transcribed Image Text:Problems 1 through 6 use the following data:
X weight for cat (pounds)
5
7
11
17 19
20
24
Y metabolic rate
1
7
5
10
7
9
19
1. Use Excel or Google sheets to make a scatter diagram with a best fit line through the points. BE
VERY CAREFUL to enter your data correctly! Which graph best indicates your result?
d
Ans.
a.
Cat weight vs metabolic rate
5
10
15
20
25
Metabolic rate
10
5
0
0
Weight
13
16
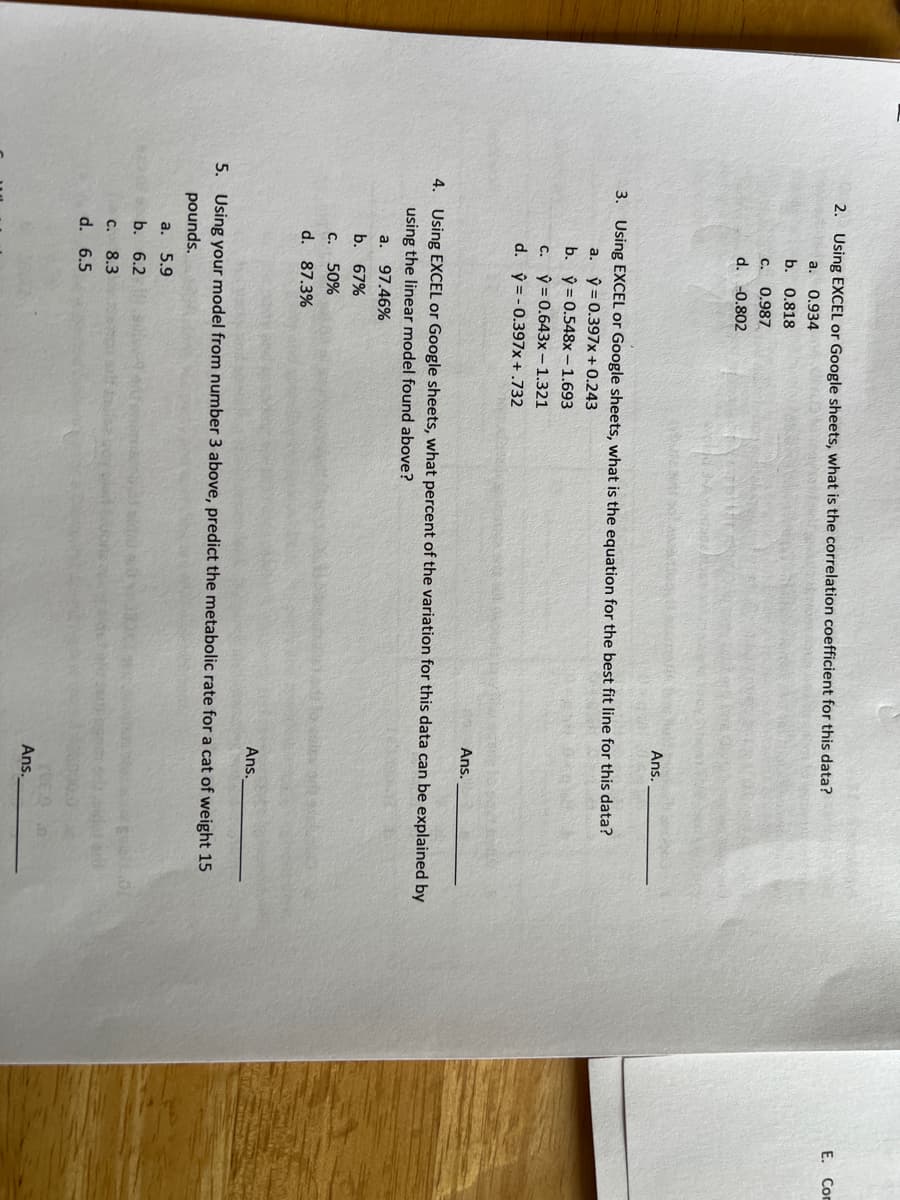
Transcribed Image Text:2. Using EXCEL or Google sheets, what is the correlation coefficient for this data?
a. 0.934
b. 0.818
C. 0.987
d. -0.802
Ans.
3. Using EXCEL or Google sheets, what is the equation for the best fit line for this data?
a. y = 0.397x + 0.243
b.
ŷ= 0.548x - 1.693
c.
y = 0.643x - 1.321
d.
ý = -0.397x+ .732
Ans.
4. Using EXCEL or Google sheets, what percent of the variation for this data can be explained by
using the linear model found above?
a. 97.46%
b. 67%
C. 50%
d. 87.3%
Ans.
5. Using your model from number 3 above, predict the metabolic rate for a cat of weight 15
pounds.
a. 5.9
b. 6.2
C. 8.3
d. 6.5
Ans.
E. Com
Expert Solution
This question has been solved!
Explore an expertly crafted, step-by-step solution for a thorough understanding of key concepts.

This is a popular solution!

Trending now
This is a popular solution!

Step by step
Solved in 4 steps with 3 images

Recommended textbooks for you
Glencoe Algebra 1, Student Edition, 9780079039897…
Algebra
ISBN:
9780079039897
Author:
Carter
Publisher:
McGraw Hill

Big Ideas Math A Bridge To Success Algebra 1: Stu…
Algebra
ISBN:
9781680331141
Author:
HOUGHTON MIFFLIN HARCOURT
Publisher:
Houghton Mifflin Harcourt
Glencoe Algebra 1, Student Edition, 9780079039897…
Algebra
ISBN:
9780079039897
Author:
Carter
Publisher:
McGraw Hill
Big Ideas Math A Bridge To Success Algebra 1: Stu…
Algebra
ISBN:
9781680331141
Author:
HOUGHTON MIFFLIN HARCOURT
Publisher:
Houghton Mifflin Harcourt