Determine if this test is left-tailed, right-tailed, or two-tailed. Oleft-tailed Oright-tailed Otwo-tailed Should the standard normal (2) distribution or Student's (t) distribution be used for this test? O The standard normal (2) distribution should be used O The Student's t distribution should be used Determine the critical value(s) for this hypothesis test. Round the solution(s) to four decimal places. If more than one critical value exists, enter the solutions using a comma-separated list. Determine the test statistic. Round the solution to four decimal places. Determine the appropriate conclusion for this hypothesis test. O The sample data do not provide sufficient evidence to reject the null hypothesis that the mean time spent gaming per week by adult gamers is 421 minutes per week and thus we conclude that it is likely the true average time spent gaming by adult gamers is 421 minutes per week. O The sample data do not provide sufficient evidence to reject the alternative hypothesis that the mean time spent gaming by adult gamers is different than 421 minutes per week and thus we conclude that the mean time spent gaming per week by adult gamers is likely different than 421 minutes. O The sample data provide sufficient evidence to reject the alternative hypothesis that the mean time spent gaming by adult gamers is different than 421 minutes per week and thus we conclude that the mean time spent gaming per week by adult gamers is likely 421 minutes. O The sample data provide sufficient evidence to reject the null hypothesis that the mean time spent gaming per week by adult gamers is 421 minutes per week and thus we conclude that it is likely the true average time spent gaming by adult gamers is different than 421 minutes per week.
Determine if this test is left-tailed, right-tailed, or two-tailed. Oleft-tailed Oright-tailed Otwo-tailed Should the standard normal (2) distribution or Student's (t) distribution be used for this test? O The standard normal (2) distribution should be used O The Student's t distribution should be used Determine the critical value(s) for this hypothesis test. Round the solution(s) to four decimal places. If more than one critical value exists, enter the solutions using a comma-separated list. Determine the test statistic. Round the solution to four decimal places. Determine the appropriate conclusion for this hypothesis test. O The sample data do not provide sufficient evidence to reject the null hypothesis that the mean time spent gaming per week by adult gamers is 421 minutes per week and thus we conclude that it is likely the true average time spent gaming by adult gamers is 421 minutes per week. O The sample data do not provide sufficient evidence to reject the alternative hypothesis that the mean time spent gaming by adult gamers is different than 421 minutes per week and thus we conclude that the mean time spent gaming per week by adult gamers is likely different than 421 minutes. O The sample data provide sufficient evidence to reject the alternative hypothesis that the mean time spent gaming by adult gamers is different than 421 minutes per week and thus we conclude that the mean time spent gaming per week by adult gamers is likely 421 minutes. O The sample data provide sufficient evidence to reject the null hypothesis that the mean time spent gaming per week by adult gamers is 421 minutes per week and thus we conclude that it is likely the true average time spent gaming by adult gamers is different than 421 minutes per week.

Holt Mcdougal Larson Pre-algebra: Student Edition 2012
1st Edition
ISBN:9780547587776
Author:HOLT MCDOUGAL
Publisher:HOLT MCDOUGAL
Chapter11: Data Analysis And Probability
Section11.4: Collecting Data
Problem 5E

Related questions
Question
100%
#30). This is 1 question. Need help with critical value and test statistic.
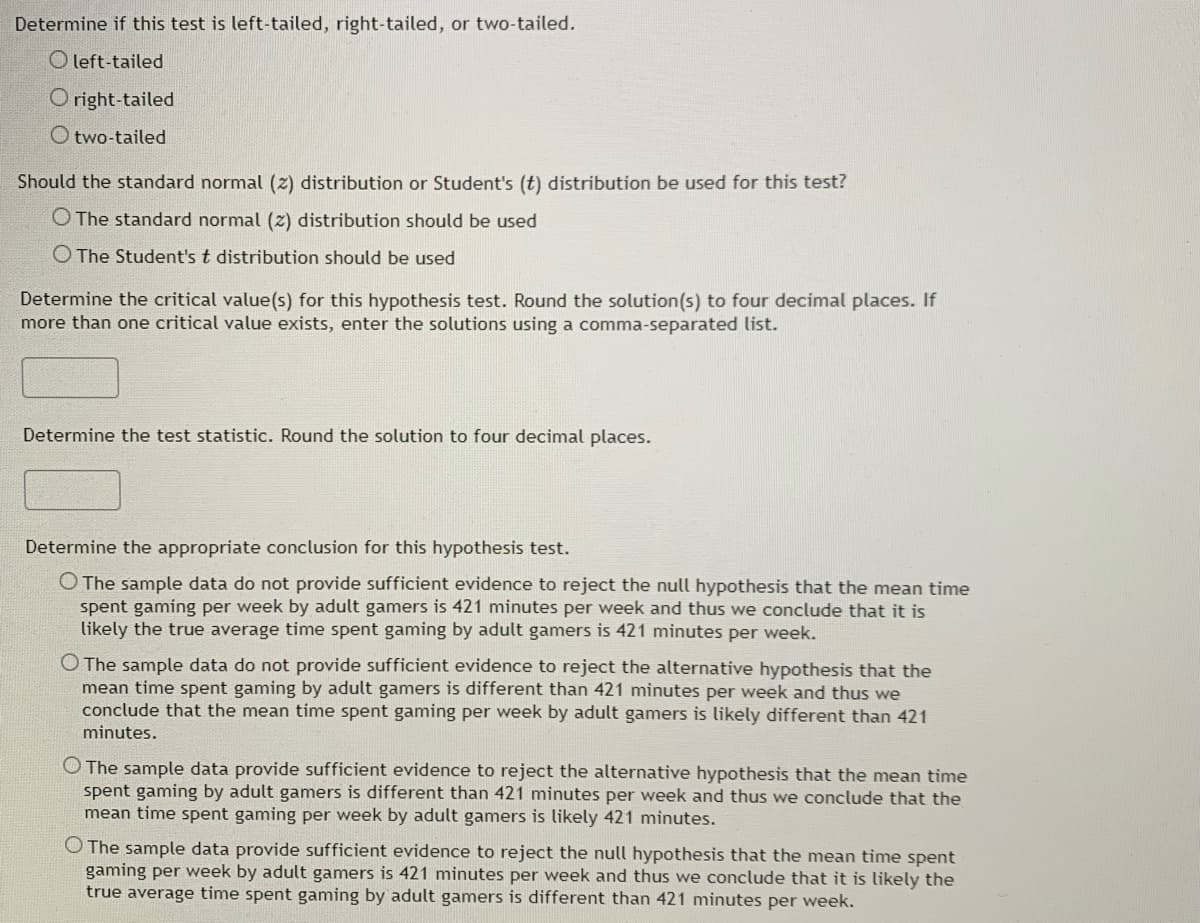
Transcribed Image Text:Determine if this test is left-tailed, right-tailed, or two-tailed.
Oleft-tailed
right-tailed
Otwo-tailed
Should the standard normal (2) distribution or Student's (t) distribution be used for this test?
O The standard normal (2) distribution should be used
The Student's t distribution should be used
Determine the critical value(s) for this hypothesis test. Round the solution (s) to four decimal places. If
more than one critical value exists, enter the solutions using a comma-separated list.
Determine the test statistic. Round the solution to four decimal places.
Determine the appropriate conclusion for this hypothesis test.
O The sample data do not provide sufficient evidence to reject the null hypothesis that the mean time
spent gaming per week by adult gamers is 421 minutes per week and thus we conclude that it is
likely the true average time spent gaming by adult gamers is 421 minutes per week.
O The sample data do not provide sufficient evidence to reject the alternative hypothesis that the
mean time spent gaming by adult gamers is different than 421 minutes per week and thus we
conclude that the mean time spent gaming per week by adult gamers is likely different than 421
minutes.
The sample data provide sufficient evidence to reject the alternative hypothesis that the mean time
spent gaming by adult gamers is different than 421 minutes per week and thus we conclude that the
mean time spent gaming per week by adult gamers is likely 421 minutes.
O The sample data provide sufficient evidence to reject the null hypothesis that the mean time spent
gaming per week by adult gamers is 421 minutes per week and thus we conclude that it is likely the
true average time spent gaming by adult gamers is different than 421 minutes per week.
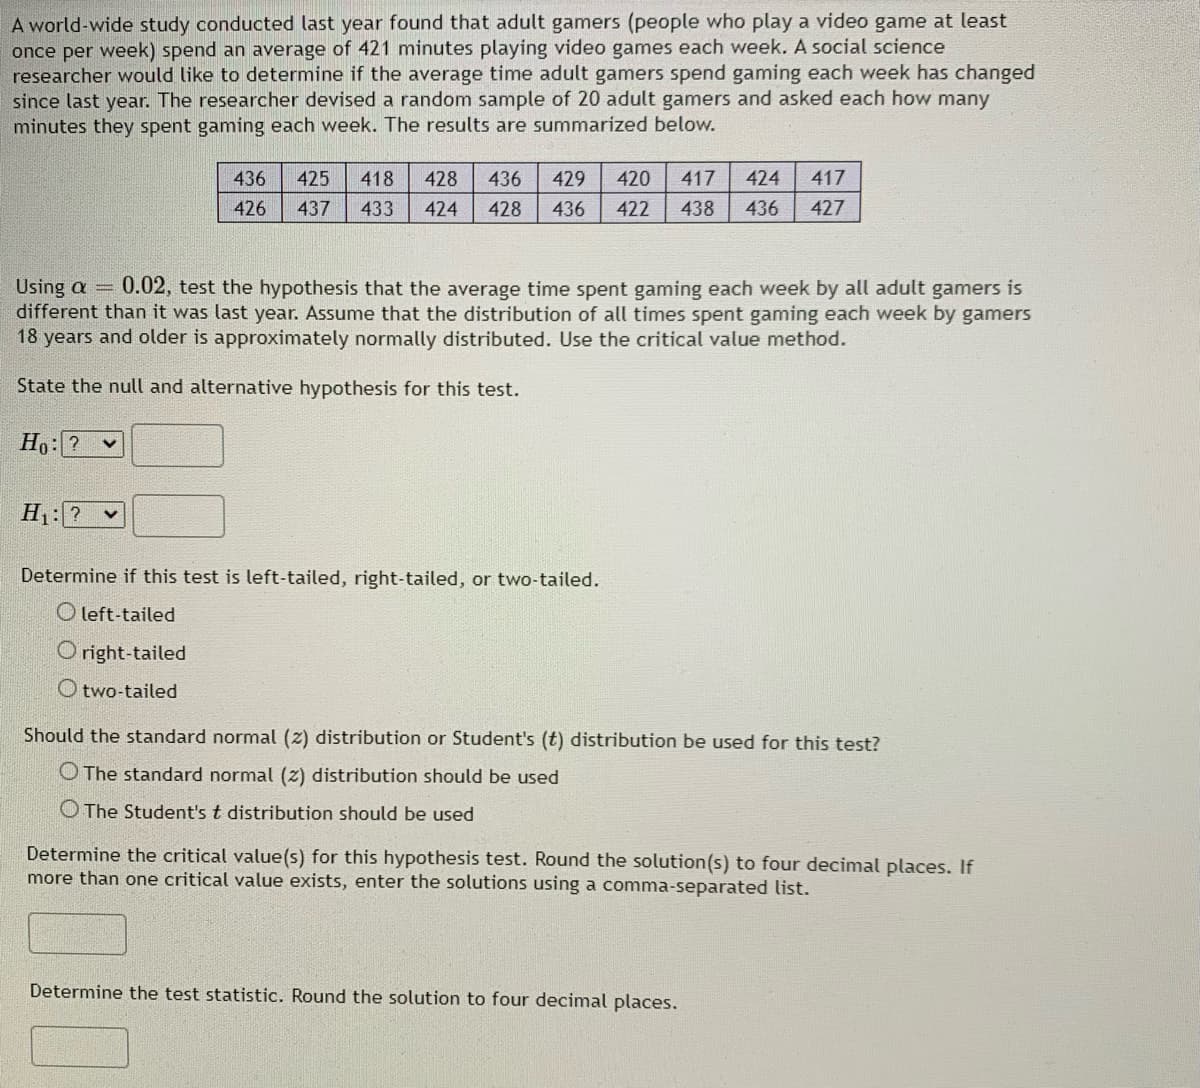
Transcribed Image Text:A world-wide study conducted last year found that adult gamers (people who play a video game at least
once per week) spend an average of 421 minutes playing video games each week. A social science
researcher would like to determine if the average time adult gamers spend gaming each week has changed
since last year. The researcher devised a random sample of 20 adult gamers and asked each how many
minutes they spent gaming each week. The results are summarized below.
417 424 417
436 425 418 428 436 429 420
426 437 433 424 428 436 422 438 436 427
Using a = 0.02, test the hypothesis that the average time spent gaming each week by all adult gamers is
different than it was last year. Assume that the distribution of all times spent gaming each week by gamers
18 years and older is approximately normally distributed. Use the critical value method.
State the null and alternative hypothesis for this test.
Ho: ?
H₁: ? ✓
Determine if this test is left-tailed, right-tailed, or two-tailed.
Oleft-tailed
Oright-tailed
Otwo-tailed
Should the standard normal (2) distribution or Student's (t) distribution be used for this test?
The standard normal (2) distribution should be used
The Student's t distribution should be used
Determine the critical value(s) for this hypothesis test. Round the solution(s) to four decimal places. If
more than one critical value exists, enter the solutions using a comma-separated list.
Determine the test statistic. Round the solution to four decimal places.
Expert Solution
This question has been solved!
Explore an expertly crafted, step-by-step solution for a thorough understanding of key concepts.

Step by step
Solved in 2 steps with 2 images

Recommended textbooks for you
Holt Mcdougal Larson Pre-algebra: Student Edition…
Algebra
ISBN:
9780547587776
Author:
HOLT MCDOUGAL
Publisher:
HOLT MCDOUGAL

College Algebra (MindTap Course List)
Algebra
ISBN:
9781305652231
Author:
R. David Gustafson, Jeff Hughes
Publisher:
Cengage Learning
Holt Mcdougal Larson Pre-algebra: Student Edition…
Algebra
ISBN:
9780547587776
Author:
HOLT MCDOUGAL
Publisher:
HOLT MCDOUGAL
College Algebra (MindTap Course List)
Algebra
ISBN:
9781305652231
Author:
R. David Gustafson, Jeff Hughes
Publisher:
Cengage Learning