2.) Using the point drawing tool, identify the new equilibrium point and label it 'B'. Note: Carefully follow the instructions above and only draw the required objects. b. The worldwide glut gets worse, and the result is a falling price level (deflation) in the United States. Figure B on the right shows an economy in an initial short-run equilibrium at point A. 1.) Using the three-point curved line drawing tool, illustrate the impact of the decrease in input prices due to the worldwide glut. Properly label this curve. 2.) Using the point drawing tool, identify the new equilibrium point and label it 'B'. Note: Carefully follow the instructions above and only draw the required objects. Price level, P ASO Yo Aggregate output (income), Y ADO
2.) Using the point drawing tool, identify the new equilibrium point and label it 'B'. Note: Carefully follow the instructions above and only draw the required objects. b. The worldwide glut gets worse, and the result is a falling price level (deflation) in the United States. Figure B on the right shows an economy in an initial short-run equilibrium at point A. 1.) Using the three-point curved line drawing tool, illustrate the impact of the decrease in input prices due to the worldwide glut. Properly label this curve. 2.) Using the point drawing tool, identify the new equilibrium point and label it 'B'. Note: Carefully follow the instructions above and only draw the required objects. Price level, P ASO Yo Aggregate output (income), Y ADO

Chapter1: Making Economics Decisions
Section: Chapter Questions
Problem 1QTC

Related questions
Question
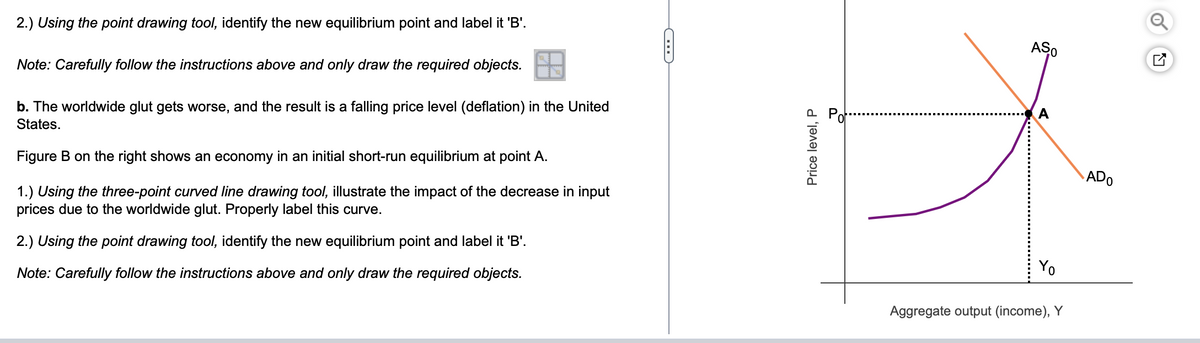
Transcribed Image Text:2.) Using the point drawing tool, identify the new equilibrium point and label it 'B'.
Note: Carefully follow the instructions above and only draw the required objects.
b. The worldwide glut gets worse, and the result is a falling price level (deflation) in the United
States.
Figure B on the right shows an economy in an initial short-run equilibrium at point A.
1.) Using the three-point curved line drawing tool, illustrate the impact of the decrease in input
prices due to the worldwide glut. Properly label this curve.
2.) Using the point drawing tool, identify the new equilibrium point and label it 'B'.
Note: Carefully follow the instructions above and only draw the required objects.
Price level, P
ASO
A
Aggregate output (income), Y
ADO
K7
Expert Solution
This question has been solved!
Explore an expertly crafted, step-by-step solution for a thorough understanding of key concepts.

This is a popular solution!

Trending now
This is a popular solution!

Step by step
Solved in 3 steps with 2 images

Knowledge Booster


Learn more about
Need a deep-dive on the concept behind this application? Look no further. Learn more about this topic, economics and related others by exploring similar questions and additional content below.Recommended textbooks for you

Principles of Economics (12th Edition)
Economics
ISBN:
9780134078779
Author:
Karl E. Case, Ray C. Fair, Sharon E. Oster
Publisher:
PEARSON

Engineering Economy (17th Edition)
Economics
ISBN:
9780134870069
Author:
William G. Sullivan, Elin M. Wicks, C. Patrick Koelling
Publisher:
PEARSON
Principles of Economics (12th Edition)
Economics
ISBN:
9780134078779
Author:
Karl E. Case, Ray C. Fair, Sharon E. Oster
Publisher:
PEARSON
Engineering Economy (17th Edition)
Economics
ISBN:
9780134870069
Author:
William G. Sullivan, Elin M. Wicks, C. Patrick Koelling
Publisher:
PEARSON

Principles of Economics (MindTap Course List)
Economics
ISBN:
9781305585126
Author:
N. Gregory Mankiw
Publisher:
Cengage Learning

Managerial Economics: A Problem Solving Approach
Economics
ISBN:
9781337106665
Author:
Luke M. Froeb, Brian T. McCann, Michael R. Ward, Mike Shor
Publisher:
Cengage Learning

Managerial Economics & Business Strategy (Mcgraw-…
Economics
ISBN:
9781259290619
Author:
Michael Baye, Jeff Prince
Publisher:
McGraw-Hill Education