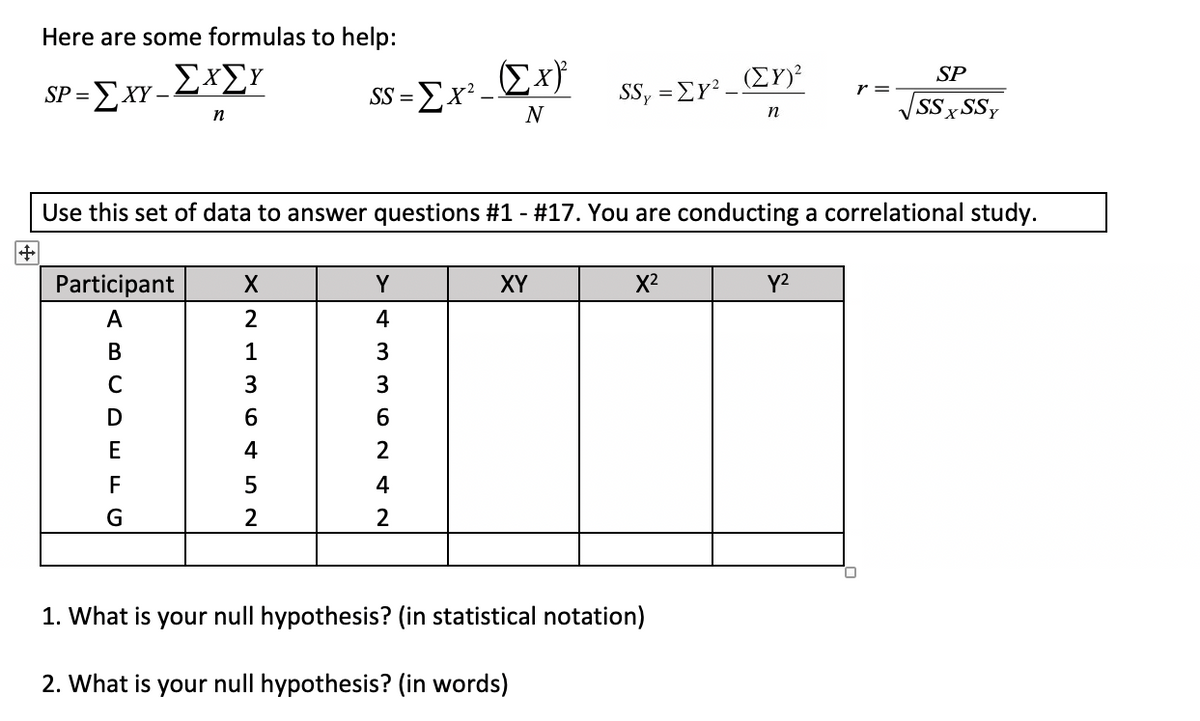
2. What is your null hypothesis? (in words)


Q: Compute for the necessary correlational analysis based on the given data. An article in Air and…
A: The regression line is used to predict the future values. It has two regression coefficients, they…
Q: Levels of a certain enzyme in the blood have a mean value of 27.0 mg/mL and a standard deviation of…
A:
Q: n 1997 a national vital statistics report indicated that about 3.7% of all births produced twins. Is…
A:
Q: 3. A researcher claims that the performance of graduates of Training Program 1 differ from the…
A: There are two independent samples which are training program 1 and training program 2. We have to…
Q: What is the population parameter? Pick What is the point estimate for the population proportion? p =…
A: We have given that Favourable cases(Hispanic/Latino), X = 68 Sample size, n = 400 Confidence level…
Q: Who determines the probability with impressive accuracy, that the binomial distribution converged to…
A: In year 1733, De Moivre invented a formula to approximate binomial sums or probabilities when the…
Q: Consider the following estimated regression with a sample of size n=50. AHE = -2.44 – 1.57 » DFemale…
A: While fitting a linear regression model, one of the most important assumption is the the variance of…
Q: Test the hypothesis using the P-value approach. Be sure to verify the requirements of the test. Ho:…
A:
Q: In 2008, there were 507 children in Arizona out of 32,601 who were diagnosed with Autism Spectrum…
A:
Q: to = (Round to two decimal places as needed.)
A: Given that Sample size n =200 Sample mean =25.5 Standard deviation =3.9
Q: A professor wants to evaluate whether testing students weekly with a quiz improves their learning of…
A: A professor wants to evaluate whether testing students weekly with a quiz improves their learning of…
Q: Suppose the sample space for a continuous random variable is 0 to 400. If the area under the density…
A: Since we know that in any probability distribution, the total area under probability distribution…
Q: Probability Identify the appropriate sample space of POSSIBLE SUMS of throwing two dices.
A:
Q: A new industrial oven has just been installed at Piatt Bakery. To develop experience regarding the…
A: Control chart are used to measure the observation or lot is in control or out of control. If the…
Q: 1) What are the values of C and k of the term Cykx20 in the polynomial expansion of (x² + y )100? 2)…
A: Since you have asked multiple questions, we will solve the first question for you. If you want any…
Q: Consider the hypotheses shown below. Given that x = 105, o = 25, n = 48, a = 0.05, complete parts a…
A: Given that Hypothesized Population Mean (\mu)(μ) = 113113 Population Standard Deviation…
Q: The lifetime of a type of battery, in hours, from a sample provided by a manufacturer is as follows…
A: For the given sample, The sample variance is, s^2=8.4889 and the sample standard deviation is…
Q: A researcher has a limited amount of time and money, so they want to choose the research design that…
A: Correct option is (A) The related samples t-test It is also known as Dependent t test and paired t…
Q: In one common system for finding a grade-point average, or GPA, A= 4, B = 3, C = 2, D = 1, F = 0.…
A: Grade point A=4, B=3, C=2, D=1,F=0
Q: Suppose you roll two dice. d) What is the probability the sum is 8? e) What is the probability that…
A: 2 dice thrown Number of possible outcome Number of Possible outcome=62=36
Q: A college entrance exam company determined that a score of 25 on the mathematics portion of the exam…
A: The hypothesized mean is 25.
Q: 76% of owned dogs in the United States are spayed or neutered. Round your answers to four decimal…
A: Given that n=33 , p=76%=0.76 Note: According to bartleby experts question answers guidelines an…
Q: In 1992, the Journal of Epidemiology and Community Health published an article that claimed that the…
A: Let X be the random variable from Normal distribution with mean (μ) = 6.6, standard deviation (σ) =…
Q: Archives of the Journal of Internal Medicine claimed that garlic has no effect on blood cholesterol,…
A: A clinical trial involving 36 subjects was conducted to test the effectiveness of garlic for…
Q: Safari File Edit View History Bookmarks Window Help A www-awu.aleks.com N Home - Netflix Typing…
A:
Q: Mr. Breuer is very proud of his hybrid vehicle, so he collected data about the number of gallons (x)…
A: Sactterplot shows the relationship between the two variables whether it is linear or non linear.
Q: In Stresstown, 1000 citizens total. Half of the citizens (500) became sick from contaminated water,…
A: The given information is A total of 1000 citizens. In that 500 citizens are sick from contaminated…
Q: Which of the following statements belong/s to the area of descriptive statistics? a. An economist…
A: As per our guidelines we are supposed to answer only one question per post so I am solving first…
Q: A medical school claims that more than 28% of its students plan to go into general practice. It is…
A: Given n=130 Pcap=39%=0.39
Q: At the 5% level, is there enough evidence to show that the proportion of Australians in November…
A: It is given that Sample size n = 631 Number of Australian thought unemployment would increase, X =…
Q: Statistical question: Is the proportion of inner-city families living on a subsistence income: 20%?…
A: Given that Sample size n =200 Favorable cases x =38 Sample proportion p^=x/n =38/200 =0.19
Q: 48. The Pearson correlation is calculated for a sample of n = 21 individuals. If a hypothesis test…
A:
Q: A box Contains 8 white balls 12 black loalls. we and give Jou the following play.. for each,…
A: Given : Number of white balls =8 Number of black balls=12 Total balls =8+12=20
Q: The failure time of a certain component has a Weibull distribution with B = 4, 0 = 2000, and y =…
A: Given, β = 4 θ = 2000 γ = 1000
Q: You toss a fair coin three times: a) What is the probability of three heads, HHH? b) What is the…
A: Here Coin toss three times The sample space is. Total possible number of outcomes = 8 The sample…
Q: Consider the following table of data. -2 -1| 0 5 13 3 51 x| -3 -19 7 9 137 a. Determine the type of…
A: Solution: 5. From the given information,
Q: It takes an average of 8.8 minutes for blood to begin clotting after an injury. An EMT wants to see…
A: Given that Hypothesized Population Mean (\mu)(μ) = 8.88.8 Sample Standard Deviation (s)(s) =…
Q: Given the following estimated model Ý=12-0.3Xie (4) (3) SSR =700, SSE=100 and n =27e Where in…
A: The independent variable is x and the dependent variable is y. We have to find the coefficient of…
Q: Frank buys a bag of cookies that contains 6 chocolate chip cookies, 9 peanut butter cookies, 6 sugar…
A:
Q: Activity: Problem Solving. Read and analyze the given problem then answer the following questions.…
A: Note: According to Bartleby guidelines, we can answer only first question with their three…
Q: A multiple regression analysis produced the following tables. Summary Output…
A: There are 2 independent variables and 1 dependent variable. We have to find the regression equation.…
Q: If the equation of the regression line for hours xx spent cycling in the summer and hours yy spent…
A: The regression equation is given by y = -0.7x + 42 Where x = hours spent cycling y = hours spent…
Q: Use a 1% level of significance to test the claim that ρ < 0 and what is your conclusion based on the…
A: To test that ρ < 0, hypotheses are, H0: ρ >= 0 H1: ρ < 0 From the above regression…
Q: We know that the wage distribution in the US is not normally distributed. It is closer to a pareto…
A: Given that We know that the wage distribution in the US is not normally distributed. It is closer…
Q: The manufacturer of running shoes conducted a study on its newly developed jogging shoe. Listed are…
A: Given that Types of nonconformity Count Heel separation 92 Sole penetration 62 Sole…
Q: The physical plant at the main campus of a large state university recieves daily requests to replace…
A: Given that X~Normal(μ=50,σ=4)
Q: Determine the t-value in each of the cases. | Click the icon to view the table of areas under the…
A: Since you have posted a question with multiple sub-parts, we will solve first three subparts for…
Q: he life of Philips voice recorder is normally distributed with a mean of 4.1 years and a standard…
A: GivenMean(μ)=4.1standard devaition(σ)=3A voice recorder is guaranteed for 3 years
Q: A survey of 2304 adults in a certain large country aged 18 and older conducted by a reputable…
A: Given X=404 n=2304
Q: 1. The resistances in ohms for a random sample of 20 resistors were recorded as follows: 990 961 920…
A:
JUST QUESTION 2 PLEASE

Step by step
Solved in 2 steps

- The correlation between the two variables of interest is 0.81, which is significant at the 0.0337 level. This means ______. Group of answer choices 1.that the null hypothesis is rejected 2.the research hypothesis is rejected 3.that the null hypothesis is accepted 4.that the null hypothesis cannot be determinedSuppose that a researcher obtains a correlation of r equals 0.60 for a sample of n equals 10 participants. Is this sample sufficient to conclude that a significant correlation exists in the population? Use a two-tailed test with alpha equal .05 if the sample had n equals 25 participants is the correlation significant? Use a two tailed test with alpha .05. What can you say about sample size based on your findings?A weight-loss program wants to test how well their program is working. The company selects a simple random sample of 51 individual that have been using their program for 15 months. For each individual person, the company records the individual's weight when they started the program 15 months ago as an x-value. The subject's current weight is recorded as a y-value. Therefore, a data point such as (205, 190) would be for a specific person and it would indicate that the individual started the program weighing 205 pounds and currently weighs 190 pounds. In other words, they lost 15 pounds. When the company performed a regression analysis, they found a correlation coefficient of r = 0.707. This clearly shows there is strong correlation, which got the company excited. However, when they showed their data to a statistics professor, the professor pointed out that correlation was not the right tool to show that their program was effective. Correlation will NOT show whether or not there is…
- It is known that the slope coefficient for regression line Y on X is 0.942 The standard deviation of X and Y are 5 and 9 respectively. Find the value of the correlation coefficient for using given information.The level of a pollutant in the river next to a chemical factory is monitored at regular intervals. Over the course of years, the level of the pollutant was determined by chemical analysis. In recent years, the company has made some changes in the factory where increases in the pollutant level can be observed. The environmental protection organization (EPA) wants convincing evidence that the level of the pollutant has not increased. By creating the relevant null and alternative hypotheses, I. type and II. describe type errors.Allison finds that the Pearson correlation coefficient for the relationship between number of pets owned and a person's IQ is +0.21. There are 25 people in her sample. Assuming an alpha level of 0.05 and a two-tailed test, what should she conclude? a. Reject the null hypothesis. The critical value is larger than the calculated value. b. Fail to reject the null hypothesis. The critical value is larger than the calculated value. c. Fail to reject the null hypothesis. The value is larger than the calculated value. d. Reject the null hypothesis. The calculated value is larger than the critical value.
- The Pearson's correlation coefficient (r) between two variables, X and Y, is calculated to be 0.8. Using a two-tailed hypothesis test with a significance level of 0.05, what is the conclusion about the relationship between X and Y?The final grade for STAT2 students depends on multiple factors . However, one of the strongest predictors is the number of hours of study per week. The correlation between the two is moderate and positive, with r = 0.7. For one of the students the number of hours of study per week is 1 SD below average. We can predict that this student will obtain a final grade that is... Group of answer choices it is impossible to say without knowing the AVG and SD of both variables 0.7 SDs above average 0.7 SDs below average 1 SDs above average 1 SDs below averageA researcher wants to determine if there is a significant difference in the number of times a new treatment for a medical condition results in relief from symptoms compared to the standard treatment. They randomly assign 20 patients to receive the new treatment and 20 to receive the standard treatment, and record the number of times each patient experienced relief from symptoms in a given period of time. The researcher uses the Wilcoxon Signed-Ranks Test to analyze the data. What is the null hypothesis for this test?
- If the null hypothesis is true in a test of the Pearson’s correlation between X and Y, then __________. a. higher scores of X are paired with higher scores of Y b. none of mentioned here c. higher scores of X are paired with low and high scores of Y d. higher scores of X are paired with lower scores of Y e. lower scores of X are paired with higher scores of YA diet center claims that it has the most effective weight loss program in the region. Its advertisements say, “Participants in our program lose more than 4 pounds within a month.” Six clients of this program are weighed on the first day of the diet and then one month later. Let the difference be defined as Weight on First Day of Diet minus Weight One Month Later. (You may find it useful to reference the appropriate table: z table or t table) (Image is table) a. Specify the null and alternative hypotheses that test the diet center’s claim. (Which is Correct) H0: μD = 4; HA: μD ≠ 4 H0: μD ≥ 4; HA: μD < 4 H0: μD ≤ 4; HA: μD > 4 b. Assuming that weight loss is normally distributed, calculate the value of the test statistic. (Round intermediate calculations to at least 4 decimal places and final answer to 2 decimal places.) Test Statistic = c. Find the p-value. p-value < 0.01 0.05 ≤ p-value < 0.10 p-value ≥0.10 0.025≤ p-value < 0.05 0.01 ≤…A doctor recorded the number of miles walked each day by patients over age 60 and the number of doctor visits in a year for 40 patients. The resulting data were used to conduct a hypothesis test to determine whether there is a linear relationship between the number of miles walked and the number of doctor visits. What are the correct hypotheses for the test?


