2. Which of the following best describes the F statistic? a. An index of within-group variability divided by between-group variability b. An index of within-group variability divided by total variability c. An index of between-group variability divided by total variability d. An index of between-group variability divided by within-group variability
2. Which of the following best describes the F statistic? a. An index of within-group variability divided by between-group variability b. An index of within-group variability divided by total variability c. An index of between-group variability divided by total variability d. An index of between-group variability divided by within-group variability

Glencoe Algebra 1, Student Edition, 9780079039897, 0079039898, 2018
18th Edition
ISBN:9780079039897
Author:Carter
Publisher:Carter
Chapter4: Equations Of Linear Functions
Section4.5: Correlation And Causation
Problem 23PFA

Related questions
Topic Video
Question
Transcribed Image Text:References
Mailings
Review
View
Help
me AQUILA ST LOUIS
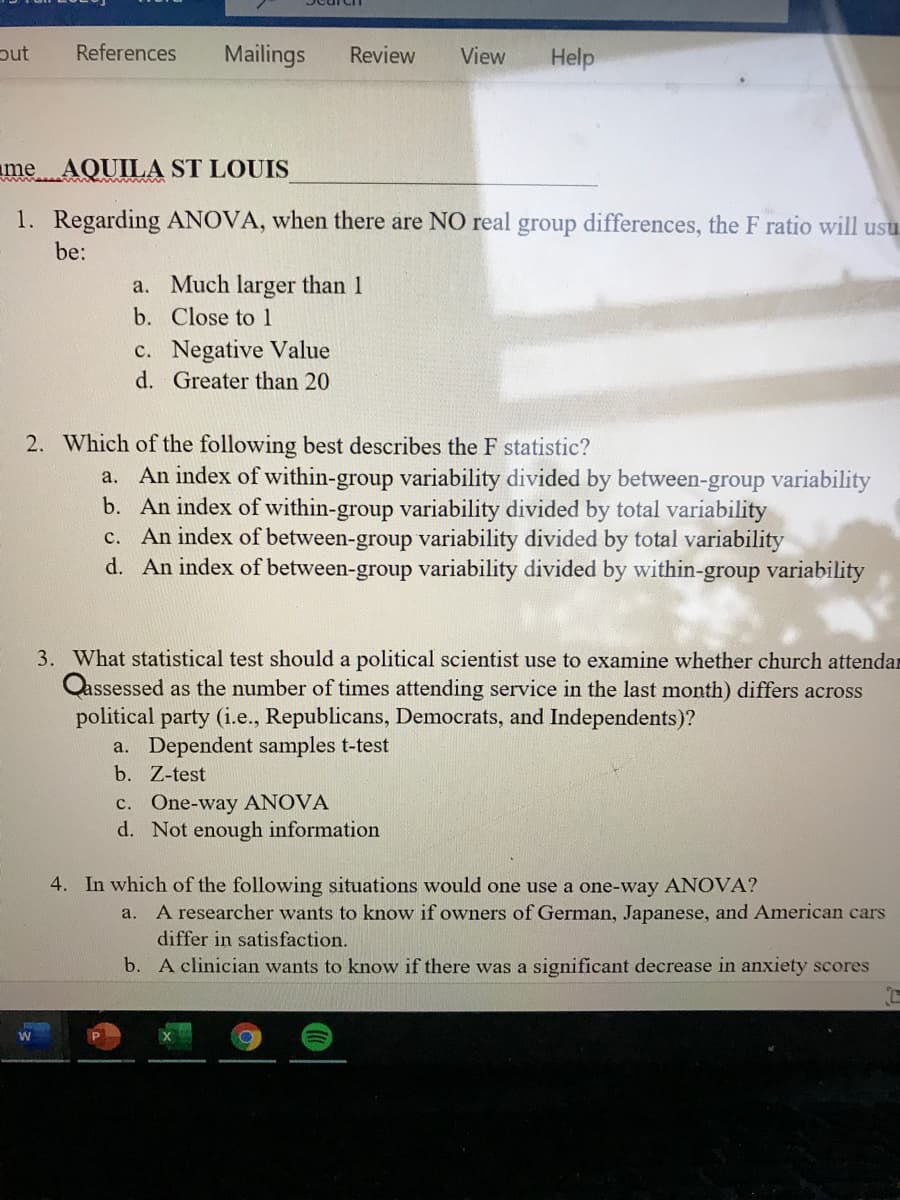
1. Regarding ANOVA, when there are NO real group differences, the F ratio will usu
be:
a. Much larger than 1
b. Close to 1
c. Negative Value
d. Greater than 20
2. Which of the following best describes the F statistic?
a. An index of within-group variability divided by between-group variability
b. An index of within-group variability divided by total variability
c. An index of between-group variability divided by total variability
d. An index of between-group variability divided by within-group variability
3. What statistical test should a political scientist use to examine whether church attendar
Qassessed as the number of times attending service in the last month) differs across
political party (i.e., Republicans, Democrats, and Independents)?
a. Dependent samples t-test
b. Z-test
c. One-way ANOVA
d. Not enough information
4. In which of the following situations would one use a one-way ANOVA?
a. A researcher wants to know if owners of German, Japanese, and American cars
differ in satisfaction.
b. A clinician wants to know if there was a significant decrease in anxiety scores
Expert Solution
This question has been solved!
Explore an expertly crafted, step-by-step solution for a thorough understanding of key concepts.

This is a popular solution!

Trending now
This is a popular solution!

Step by step
Solved in 2 steps

Knowledge Booster


Learn more about
Need a deep-dive on the concept behind this application? Look no further. Learn more about this topic, statistics and related others by exploring similar questions and additional content below.Recommended textbooks for you
Glencoe Algebra 1, Student Edition, 9780079039897…
Algebra
ISBN:
9780079039897
Author:
Carter
Publisher:
McGraw Hill
Glencoe Algebra 1, Student Edition, 9780079039897…
Algebra
ISBN:
9780079039897
Author:
Carter
Publisher:
McGraw Hill