2.3 Pulse Rates The histogram shown is for pulse rates for 125 people. Convert the vertical axis to relative frequency and show the value that would replace each of the values on the vertical axis. (Source: NHANES) Frequency 25 20 15 10 5 0 50 60 70 80 90 100 110 120 Pulse Rate (beats per minute)
2.3 Pulse Rates The histogram shown is for pulse rates for 125 people. Convert the vertical axis to relative frequency and show the value that would replace each of the values on the vertical axis. (Source: NHANES) Frequency 25 20 15 10 5 0 50 60 70 80 90 100 110 120 Pulse Rate (beats per minute)

Glencoe Algebra 1, Student Edition, 9780079039897, 0079039898, 2018
18th Edition
ISBN:9780079039897
Author:Carter
Publisher:Carter
Chapter10: Statistics
Section10.5: Comparing Sets Of Data
Problem 26PFA

Related questions
Question
2.3 -
Convert the vertical axis to relative frequency and show the value that would replace each of the values on the vertical axis
Transcribed Image Text:dorplot of the glucose readings fr
132 people
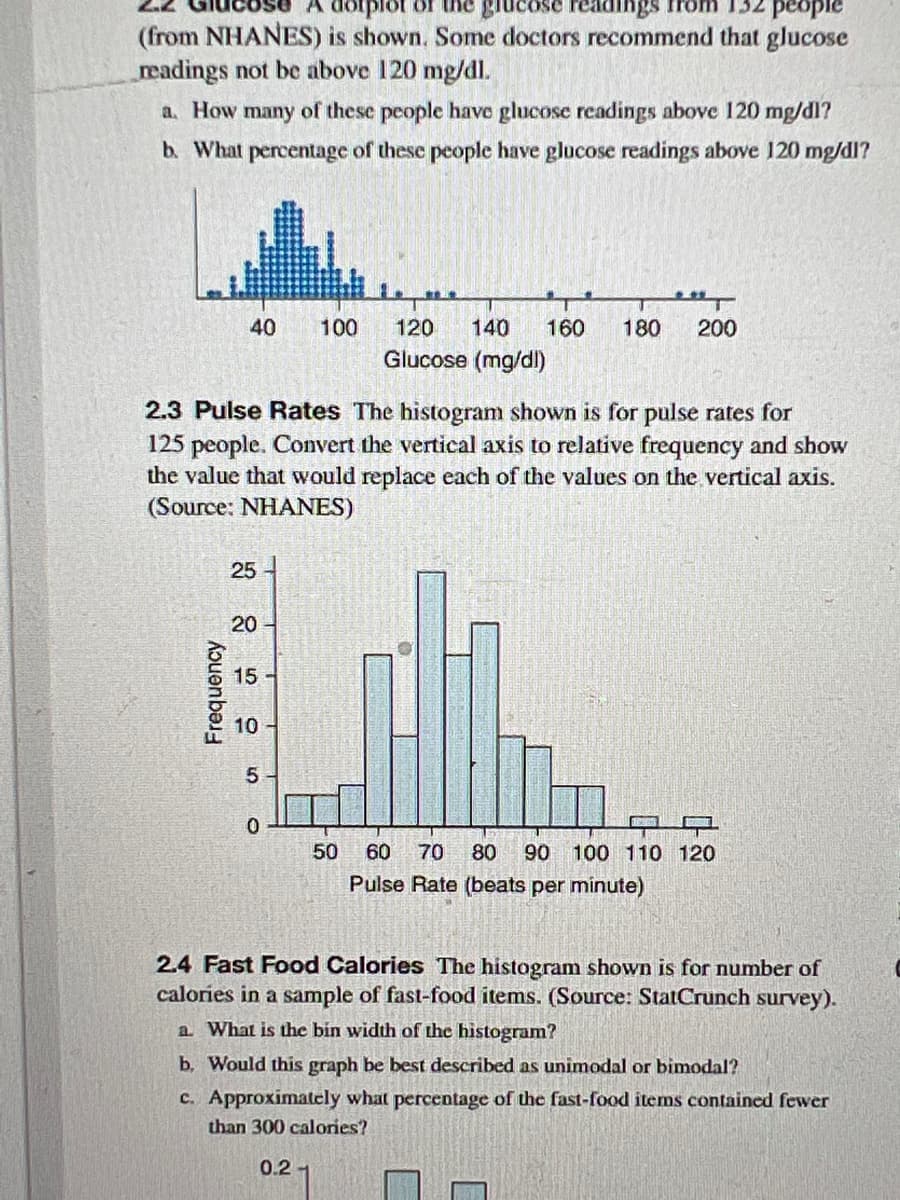
(from NHANES) is shown. Some doctors recommend that glucose
readings not be above 120 mg/dl.
a. How many of these people have glucose readings above 120 mg/dl?
b. What percentage of these people have glucose readings above 120 mg/dl?
40 100 120 140 160 180 200
Glucose (mg/dl)
2.3 Pulse Rates The histogram shown is for pulse rates for
125 people. Convert the vertical axis to relative frequency and show
the value that would replace each of the values on the vertical axis.
(Source: NHANES)
Frequency
25
20-
15-
10-
5
0
50
Expan
60 70 80 90 100 110 120
Pulse Rate (beats per minute)
2.4 Fast Food Calories The histogram shown is for number of
calories in a sample of fast-food items. (Source: StatCrunch survey).
a. What is the bin width of the histogram?
b. Would this graph be best described as unimodal or bimodal?
c. Approximately what percentage of the fast-food items contained fewer
than 300 calories?
0.21
Expert Solution
This question has been solved!
Explore an expertly crafted, step-by-step solution for a thorough understanding of key concepts.

This is a popular solution!

Trending now
This is a popular solution!

Step by step
Solved in 3 steps with 1 images

Recommended textbooks for you
Glencoe Algebra 1, Student Edition, 9780079039897…
Algebra
ISBN:
9780079039897
Author:
Carter
Publisher:
McGraw Hill

Holt Mcdougal Larson Pre-algebra: Student Edition…
Algebra
ISBN:
9780547587776
Author:
HOLT MCDOUGAL
Publisher:
HOLT MCDOUGAL

Algebra: Structure And Method, Book 1
Algebra
ISBN:
9780395977224
Author:
Richard G. Brown, Mary P. Dolciani, Robert H. Sorgenfrey, William L. Cole
Publisher:
McDougal Littell
Glencoe Algebra 1, Student Edition, 9780079039897…
Algebra
ISBN:
9780079039897
Author:
Carter
Publisher:
McGraw Hill
Holt Mcdougal Larson Pre-algebra: Student Edition…
Algebra
ISBN:
9780547587776
Author:
HOLT MCDOUGAL
Publisher:
HOLT MCDOUGAL
Algebra: Structure And Method, Book 1
Algebra
ISBN:
9780395977224
Author:
Richard G. Brown, Mary P. Dolciani, Robert H. Sorgenfrey, William L. Cole
Publisher:
McDougal Littell

Big Ideas Math A Bridge To Success Algebra 1: Stu…
Algebra
ISBN:
9781680331141
Author:
HOUGHTON MIFFLIN HARCOURT
Publisher:
Houghton Mifflin Harcourt