20. A teller at a drive-up window at a bank had the following service times (in minutes) for 20 randomly Chapter Ten Quality Control selected customers. SAMPLE 3 4 1 4.6 4.5 4.7 4.5 4.5 4.6 4.6 4.2 4.4 4.4 4.8 4.2 4.3 4.7 4.4 4.5 4.3 4.3 4.6 4.9 a. Determine the mean of each sample. b. If the process parameters are unknown, estimate its mean and standard deviation. c. Estimate the mean and standard deviation of the sampling distribution. d. What would three-sigma control limits for the process be? What alpha risk would they provide? e. What alpha risk would control limits of 4.14 and 4.86 provide? f. Using limits of 4.14 and 4.86, are any sample means beyond the control limits? If so, which one(s)? g. Construct control charts for means and ranges using Table 10.3. Are any samples beyond the control limits? If so, which one(s)? h. Explain why the control limits are different for means in parts d and g. 1. If the process has a known mean of 4.4 and a known standard deviation of .18, what would three-sigma control limits be for a mean chart? Are any sample means beyond the control limits? If so, which one(s)? 21. A process that produces computer chips has a mean of .04 defective chip and a standard devia. of .003 chip. The allowable variation is from .03 to .05 defective.
20. A teller at a drive-up window at a bank had the following service times (in minutes) for 20 randomly Chapter Ten Quality Control selected customers. SAMPLE 3 4 1 4.6 4.5 4.7 4.5 4.5 4.6 4.6 4.2 4.4 4.4 4.8 4.2 4.3 4.7 4.4 4.5 4.3 4.3 4.6 4.9 a. Determine the mean of each sample. b. If the process parameters are unknown, estimate its mean and standard deviation. c. Estimate the mean and standard deviation of the sampling distribution. d. What would three-sigma control limits for the process be? What alpha risk would they provide? e. What alpha risk would control limits of 4.14 and 4.86 provide? f. Using limits of 4.14 and 4.86, are any sample means beyond the control limits? If so, which one(s)? g. Construct control charts for means and ranges using Table 10.3. Are any samples beyond the control limits? If so, which one(s)? h. Explain why the control limits are different for means in parts d and g. 1. If the process has a known mean of 4.4 and a known standard deviation of .18, what would three-sigma control limits be for a mean chart? Are any sample means beyond the control limits? If so, which one(s)? 21. A process that produces computer chips has a mean of .04 defective chip and a standard devia. of .003 chip. The allowable variation is from .03 to .05 defective.

Practical Management Science
6th Edition
ISBN:9781337406659
Author:WINSTON, Wayne L.
Publisher:WINSTON, Wayne L.
Chapter2: Introduction To Spreadsheet Modeling
Section: Chapter Questions
Problem 20P: Julie James is opening a lemonade stand. She believes the fixed cost per week of running the stand...

Related questions
Question
100%
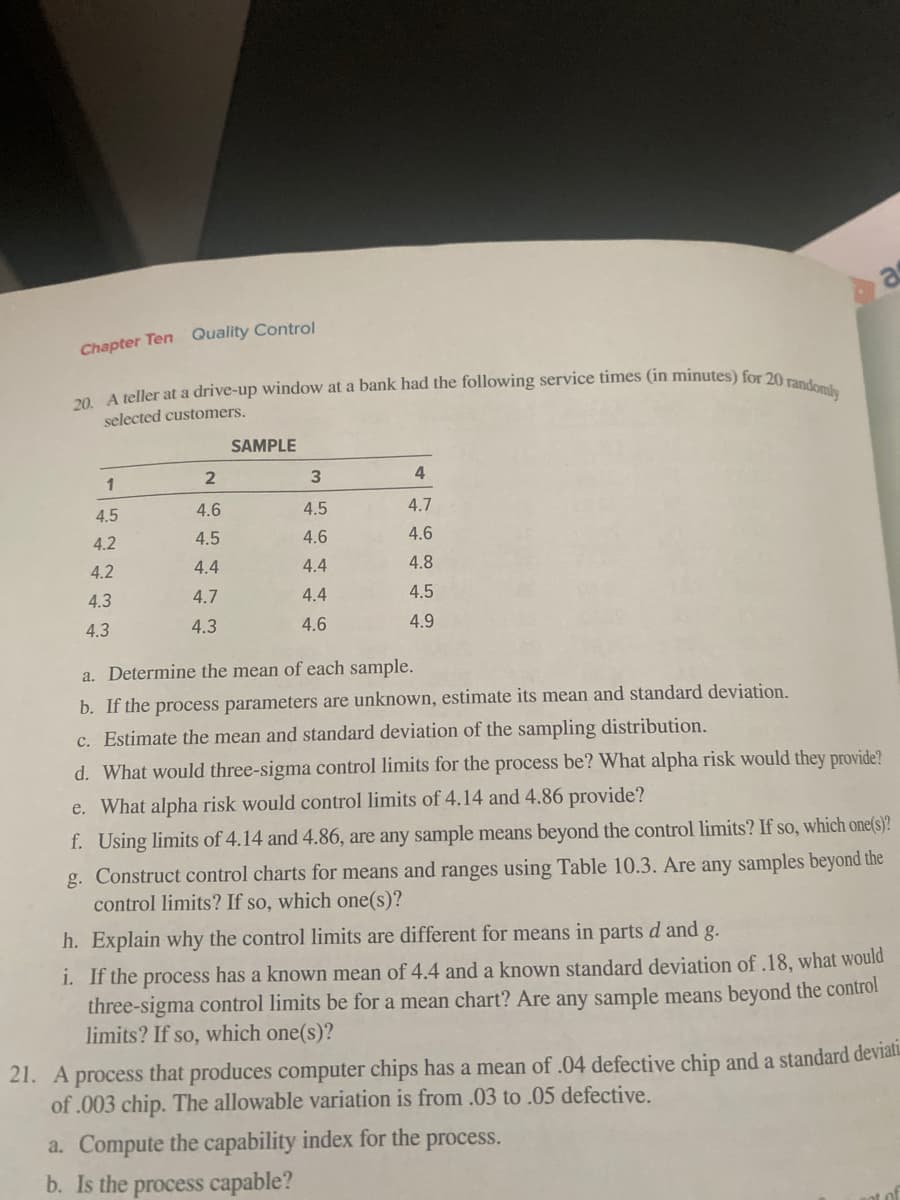
Transcribed Image Text:20. A teller at a drive-up window at a bank had the following service times (in minutes) for 20 randomly
Chapter Ten Quality Control
selected customers.
SAMPLE
1
4.
4.5
4.6
4.5
4.7
4.2
4.5
4.6
4.6
4.2
4.4
4.4
4.8
4.3
4.7
4.4
4.5
4.3
4.3
4.6
4.9
a. Determine the mean of each sample.
b. If the process parameters are unknown, estimate its mean and standard deviation.
c. Estimate the mean and standard deviation of the sampling distribution.
d. What would three-sigma control limits for the process be? What alpha risk would they provide?
e. What alpha risk would control limits of 4.14 and 4.86 provide?
f. Using limits of 4.14 and 4.86, are any sample means beyond the control limits? If so, which one(s)?
g. Construct
control limits? If so, which one(s)?
ontrol charts for means and ranges using Table 10.3. Are any samples beyond the
h. Explain why the control limits are different for means in parts d and
g.
i. If the process has a known mean of 4.4 and a known standard deviation of .18, what would
three-sigma control limits be for a mean chart? Are any sample means beyond the control
limits? If so, which one(s)?
21. A process that produces computer chips has a mean of .04 defective chip and a standard deviati.
of .003 chip. The allowable variation is from .03 to .05 defective.
a. Compute the capability index for the process.
b. Is the process capable?
Expert Solution
This question has been solved!
Explore an expertly crafted, step-by-step solution for a thorough understanding of key concepts.

This is a popular solution!

Trending now
This is a popular solution!

Step by step
Solved in 2 steps

Recommended textbooks for you
Practical Management Science
Operations Management
ISBN:
9781337406659
Author:
WINSTON, Wayne L.
Publisher:
Cengage,

Operations Management
Operations Management
ISBN:
9781259667473
Author:
William J Stevenson
Publisher:
McGraw-Hill Education

Operations and Supply Chain Management (Mcgraw-hi…
Operations Management
ISBN:
9781259666100
Author:
F. Robert Jacobs, Richard B Chase
Publisher:
McGraw-Hill Education
Practical Management Science
Operations Management
ISBN:
9781337406659
Author:
WINSTON, Wayne L.
Publisher:
Cengage,
Operations Management
Operations Management
ISBN:
9781259667473
Author:
William J Stevenson
Publisher:
McGraw-Hill Education
Operations and Supply Chain Management (Mcgraw-hi…
Operations Management
ISBN:
9781259666100
Author:
F. Robert Jacobs, Richard B Chase
Publisher:
McGraw-Hill Education


Purchasing and Supply Chain Management
Operations Management
ISBN:
9781285869681
Author:
Robert M. Monczka, Robert B. Handfield, Larry C. Giunipero, James L. Patterson
Publisher:
Cengage Learning

Production and Operations Analysis, Seventh Editi…
Operations Management
ISBN:
9781478623069
Author:
Steven Nahmias, Tava Lennon Olsen
Publisher:
Waveland Press, Inc.