20. Size of American households In government data, a household consists of all occupants of a dwelling unit, while a family consists of two or more persons who live together and are related by blood or marriage. So all families form households, but some households are not families. Here are the distributions of household size and family size in the United States: 1 sehold probability 0.25 ly probability 0 Number of Persons 2 3 4 5 0.32 0.17 0.15 0.07 0.42 0.23 0.21 0.09 67 0.03 0.01 0.03 0.02 Let X = the number of people in a randomly selecte U.S. household and Y = the number of people in a randomly chosen U.S. family. (a) Make histograms suitable for comparing the probability distributions of X and Y. Describe any differences that you observe. (b) Find the mean for each random variable. Ex- plain why this difference makes sense. (e) Find the standard deviations of both X and Y. Explain why this difference makes sense.
20. Size of American households In government data, a household consists of all occupants of a dwelling unit, while a family consists of two or more persons who live together and are related by blood or marriage. So all families form households, but some households are not families. Here are the distributions of household size and family size in the United States: 1 sehold probability 0.25 ly probability 0 Number of Persons 2 3 4 5 0.32 0.17 0.15 0.07 0.42 0.23 0.21 0.09 67 0.03 0.01 0.03 0.02 Let X = the number of people in a randomly selecte U.S. household and Y = the number of people in a randomly chosen U.S. family. (a) Make histograms suitable for comparing the probability distributions of X and Y. Describe any differences that you observe. (b) Find the mean for each random variable. Ex- plain why this difference makes sense. (e) Find the standard deviations of both X and Y. Explain why this difference makes sense.

Glencoe Algebra 1, Student Edition, 9780079039897, 0079039898, 2018
18th Edition
ISBN:9780079039897
Author:Carter
Publisher:Carter
Chapter10: Statistics
Section10.4: Distributions Of Data
Problem 19PFA

Related questions
Question
Q.20
(If you could write it out on paper I'd really appreciate it please)
Transcribed Image Text:Explain why this difference makes sense.
who
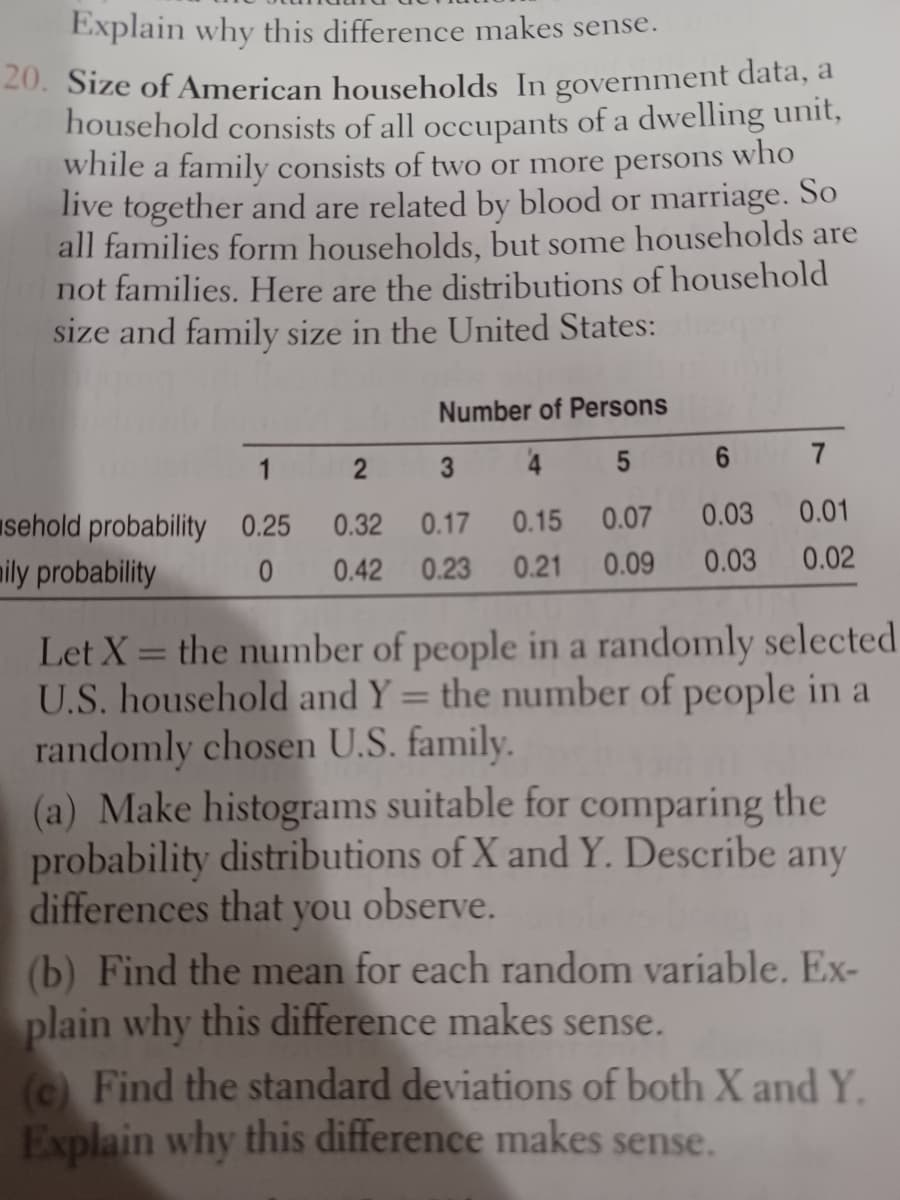
20. Size of American households In government data, a
household consists of all occupants of a dwelling unit,
while a family consists of two or more persons
live together and are related by blood or marriage. So
all families form households, but some households are
not families. Here are the distributions of household
size and family size in the United States:
1
sehold probability 0.25
ily probability
0
Number of Persons
3 4 5 6 7
0.15 0.07
0.32 0.17
0.01
0.03
0.42 0.23 0.21 0.09 0.03 0.02
Let X = the number of people in a randomly selected
U.S. household and Y = the number of people in a
randomly chosen U.S. family.
(a) Make histograms suitable for comparing the
probability distributions of X and Y. Describe any
differences that you observe.
(b) Find the mean for each random variable. Ex-
plain why this difference makes sense.
(c) Find the standard deviations of both X and Y.
Explain why this difference makes sense.
Expert Solution
This question has been solved!
Explore an expertly crafted, step-by-step solution for a thorough understanding of key concepts.

Step by step
Solved in 2 steps with 6 images

Recommended textbooks for you
Glencoe Algebra 1, Student Edition, 9780079039897…
Algebra
ISBN:
9780079039897
Author:
Carter
Publisher:
McGraw Hill
Glencoe Algebra 1, Student Edition, 9780079039897…
Algebra
ISBN:
9780079039897
Author:
Carter
Publisher:
McGraw Hill