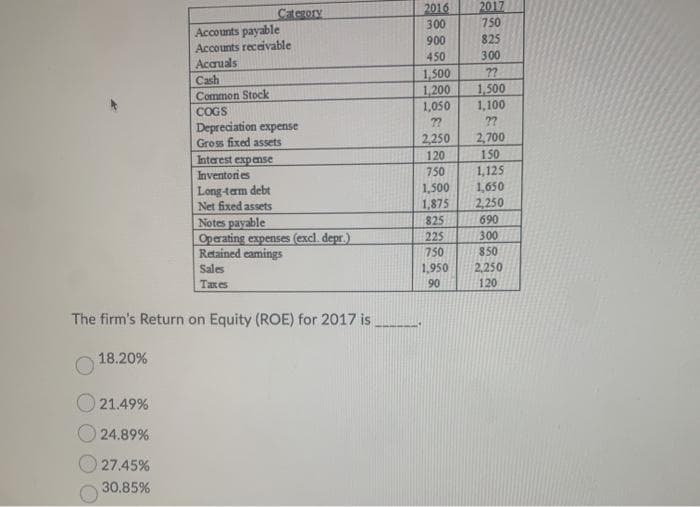
2017 750 Cterory 2016 300 Accounts payable Accounts receivable Accruals Cash 900 825 450 300 1,500 1,200 1,050 ?? 1,500 1,100 Common Stock COGS Depreciation expense Gross fixed assets 77 2? 2,700 150 1,125 1,650 2,250 690 300 2250 Interest expense 120 Inventories 750 Long-tam debt Net fixed assets 1,500 1,875 Notes payable Operating expenses (excl. depr.) Retained eamings 825 225 750 850 Sales 1,950 90 2,250 Taxes 120 The firm's Return on Equity (ROE) for 2017 is


Q: Cash flow from assets. Use the data from the following financial statements in tthe popup window,…
A: Cash flow statement shows the cash outflows and inflows from different activities and it does not…
Q: Item Prior year Current year Accounts payable 8,191.00 7,813.00 Accounts receivable 6,005.00…
A: Balance sheet shows the assets, liabilities and shareholders equity of the company during the…
Q: Win's Companies Balance Sheet May 31, 2018 and 2017 Assets Liabilities 2018 2017 2018 2017 Cash %24…
A: Current ratio: The financial ratio which evaluates the ability of a company to pay off the debt…
Q: Carla Vista Co. has these comparative balance sheet data: CARLA VISTA CO. Balance Sheets December…
A: a. Calculate the current ratio:
Q: The Maness Corporation's financial statements are shown below, along with the changes in the balance…
A: A cash flow statement is a type of financial statement that gives the combined data related to all…
Q: Brief Exercise 221 Corsig Corporation had the following comparative current assets and current…
A: Calculate the current ratio as follows: Current ratio = Current assets / Current liabilities
Q: 2018 2017 Assets Cash 90,800 48,400 Accounts receivable 92,800 33,000 Inventories…
A: Statement of cash flows is one of the financial statement of the business. It shows all cash inflows…
Q: Use the common-size financial statements found here: ommon-Size Balance Sheet 2016 Cash and…
A: “Since you have posted a question with multiple sub-parts, we will solve first three sub-parts for…
Q: Item Prior year Current year Accounts payable 8,101.00 7,904.00 Accounts receivable 6,019.00…
A: Change in cash: It is the difference between the prior years and current year when the current cash…
Q: 6- Consider the following financial statements (in millions of TL). What would be the retained…
A: Retained earnings for the Year 2016 = Change in the retained earnings
Q: tem Prior year Current year Accounts payable 8,126.00 7,784.00 Accounts receivable 6,078.00 6,607.00…
A: The cash flow statement is an essential part of the financial statements of the organization. It is…
Q: Balance Sheet as of December 31, 2013 and 2014 ASSETS 2014 2013 LIABILITIES 2014 2013 Current assets…
A: Ratio analysis is used to evaluate and analyze the financial viability of the company by the…
Q: The following data were taken from the balance sheet of Nilo Company at the end of two recent fiscal…
A: The ratio analysis helps to analyze the financial statements of the business.
Q: ABC Coffee 2018 and 2019 Balance Sheet 2018 2019 2018 2019…
A: Since you have posted a question with multiple sub-parts, we will solve the first three subparts for…
Q: Item Prior year Current year Accounts payable 8,142.00 7,800.00 Accounts receivable 6,080.00…
A: The question is based on the concept of Cashflow statements.
Q: 2017 2016 Current assets Cash and cash equivalents S330 $360 Accounts receivable (net) 570 500…
A: Ratio Analysis - The ratio is the technique used by the prospective investor or an individual or…
Q: Diane's balance sheets as of December 31, 2016 and 2017 are presented below: 2016 310,000 300,000 0…
A: Indirect Method:The indirect method presents the statement of cash flows beginning with net income…
Q: 2018 2017 Cash P 39,000 P 13,000 Accounts Receivable 46,000 61,000 Merchandise Inventory 94,000…
A: Statement of Cash Flows: Statement of Cash Flow is one of the main four financial statements,…
Q: Quantitative Problem: Rosnan Industries' 2018 and 2017 balance sheets and income statements are…
A: Disclaimer: "Since you have posted a question with multiple sub-parts, we will solve the first three…
Q: Category Prior Year Current Year Accounts payable 3,134.00 5,904.00 Accounts receivable 6,978.00…
A: Cash flow statement shows cash flows from three activities i.e. operating activities, investment…
Q: JKL Company COMPARATIVE BALANCE SHEET For the Year 2015 & 2016 2015 290,000 Assets 2016 400,000 Cash…
A: Gross Margin Ratio = Gross Margin / Net Sales Profit Margin Ratio = Net income / Net sales
Q: Current Year Previous Year Current assets: Cash $532,000 $439,200 Marketable securities 616,000…
A: Ratio analysis is a method of measuring the financial position of the organization with different…
Q: Assets Liabilities and Owners' Equity 2020 2021 2020 2021 Current Assets…
A:
Q: Item Prior year Current year Accounts payable 8,122.00 7,930.00 Accounts receivable 6,011.00…
A: Cash flow from investing activity includes all those cash outflows and inflows which are related to…
Q: How to convert a balance sheet to a common size balance sheet
A: Common-sized financial statements: Common-sized financial statements are useful for the analysts in…
Q: Q Analysis of Financial Statement: The Balance Sheet Decent Limiled of December, 31 , 2017 on Assets…
A: Since you have posted a question with multiple sub-parts, we will solve the first three sub-parts…
Q: The Maness Corporation's financial statements are shown below, along with the changes in the balance…
A: Statement of cash flows: It is one of the financial statement that shows the cash and cash…
Q: Vockery Market Co. Balance Sheet 2018 2017 Cash 20,000 24,000 ST Investments…
A: Ratio analysis means where different ratio of various years of years companies has been compared and…
Q: Item Prior year Current year Accounts payable 8,112.00 7,889.00 Accounts receivable 6,029.00…
A: Statement of cash flows: The statement of cash flows records all the sources and use of the cash in…
Q: Liberty Corporation reported the following figures: Account 2016 2015 Cash and cash equivalents $ 2…
A: Vertical analysis of Balance sheet , shows all the assets as a percentage of total assets =…
Q: BT21 Co. provided the following data: 2021 2020 Cash P 350,000 840,000 P150,000 Accounts Receivable,…
A: Cash flows from operating activities: It is a section of Statement of cash flow that explains the…
Q: Current Year Previous Year Current assets: Cash $655,500 $520,000 Marketable securities 759,000…
A: Formula: Working capital = Current Assets - Current liabilities.
Q: Balance Sheets At December 31 2018 2017 2018 2017 Assets: $ 24,640 $ 23,040 32,180 73,125 55,900…
A: Cash Flow Statement is the part of Financial Statement which shows the net increase/decrease in Cash…
Q: Item Prior year Current year Accounts payable 8,113.00 7,909.00 Accounts receivable 6,029.00…
A: Cash Flow from investing activity only includes details of Investment made in shares or fixed…
Q: December 31. 2017 2016 Cash $ 176,700 $ 45,000 Accounts receivable 118,900 78,400 Investments 69,900…
A: The movement of money in and out of a business is referred to as cash flow. The cash flow statement…
Q: The following data were taken from the balance sheet of Nilo Company at the end of two recent fiscal…
A: 1(a)
Q: Balance Sheet Year 2014 & 2015 (amounts in $) 2014 2015 Cash 140 210 Accounts receivable 340 380…
A: Option "A" is the Correct Answer. i.e 0.83
Q: JUST DEW IT CORPORATION 2017 and 2018 Balance Sheets Assets Liabilities and Owners' Equity 2017…
A: The question is based on the concept of ratio analysis.
Q: Bettancort Inc. Comparative Balance Sheet December 31, 2016 and 2015 Dec. 31, 2016 Dec. 31, 2015…
A:
Q: FBC statement of financial position (R millions) 2018 2017 Cash and equivalents R149 R83…
A: 1. The calculation is:
Q: Windswept, Inc. 2017 Income Statement ($ in millions) Net sales $ 11,000 Cost of goods sold…
A: Dividend is the declared portion of the net profit which is distributed among the shareholder and it…
Q: Item Prior year Current year Accounts payable 8,100.00 7,786.00 Accounts receivable 6,081.00…
A: Indirect method of cash flow statement involves a reconciliation from profit before tax, adjusting…
Q: Balance sheet 2018 201구 2016 cash cash. Short term inestments net recievables inventory prepaid…
A: Current ratio = Current assets/Current liabilities
Q: Item Prior year Current year Accounts payable 8,118.00 7,921.00 Accounts receivable 6,037.00…
A: Statement of Cash Flows Cash Flow from Financing Activities Issue of Common…
Q: GEHstron Manufacturing Corporatlo Balance Shect 2017 216 ASSETS Cach $41,752 $51,378 Accts.…
A: A balance sheet is a statement which provides financial data related to the assets, liabilities and…
Q: Balance Sheet Data Assets 2019 2018 2017 Liabilities 2019 2018 2017 Cash & C.E. Acct. Rec…
A: Common size analysis is a tool which is used by managers to evaluate the percentage of various…
Q: Current Accounts 2015: Current Assets= 4,400; Current Liabilities = 1,500 2014:…
A: Since you have posted a question with multiple sub-parts, we will solve first three subparts for…


Trending now
This is a popular solution!

Step by step
Solved in 3 steps


- ShafNita Sdn. Bhd. Statement of Financial Position as at 31 December2019 2020RM RM RM RM Non Current AssetsBuilding 100,000 100,000Fixtures less accumulated depreciation 3,600 4,000Van less accumulated depreciation 7,840 14,800111,440 118,800 Current AssetInventory 11,200 24,800Trade account receivable 12,800 16,400Bank 1,800 -Cash 440 400 26,240 41,600Total assets 137,680 160,400Finance by:Capital account:Balance at 1 January 74,080 105,080Add: Net profit for the year 70,400 42,320Cash introduced - 20,000144,480 167,400Less: Drawings (39,400) (43,200)105,080 124,200 Non Current LiabilitiesLoan (repayable in 10 years time) 20,000 30,000Current LiablitiesAccount Payable 12,600 6,012Bank overdraft - 188Retained earnings 32,600 36,200Total liabilities and equity 137,680 160,400 Additional information at 31 December 2020: Fixtures bought in 2020 cost RM800. Van bought in 2020 cost RM11,000. Required: Prepare statement of cash flow for ShafNita Sdn. Bhd. for the year ended 31 December…J9998. Assets: Cash and cash equivalents Accounts receivable Inventory Property, plant, and equipment Less accumulated depreciation Total assets Liabilities and stockholders equity: Accounts payable Bonds payable Common stock Retained earnings Total liabilities and stockholders equity Sales Cost of goods sold Gross margin Selling and administrative expense Net operating income Income taxes Net income Comparative Balance Sheet Mutiple Choice O$(153) O 5153 Income Statement $(35) $35 $ 818 284 526 105 421 149 $ 272 Ending Beginning Balance Balance $45 108 67 Cash dividends were $35. The company did not dispose of any property, plant, and equipment. It did not issue any bonds payable or repurchase any of its own common stock. The following questions pertain to the company's statement of cash flows. The net cash provided by (used in) investing activities for the year was. 843 372 $ 691 $85 200 119 287 $ 691 $42 93 52 690 320 $ 557 $94 320 93 50 $ 557What is the value of the company's quick current assets?A. $ 164,477B. $ 305,885C. $ 243,146D. $ 486,266
- SME Balance Sheet 2021 2020 Assets (in millions) Cash 85.960 56.460 Receivables 89.560 80.670 Inventories 55.750 41.260 Other Current Assets 9.950 6.760 Total Current Assets 241.220 185.150 Net Property, Plant, and Equipment 78.970 68.930 Goodwill and Other Intangible Assets 103.110 104.360 Other Non-Current Assets 6.900 4.200 Total Assets 430.200 362.640 Total Liabilities and Shareholders' Equity Payables 83.240 57.48 Current Debt 2.700 2.64 Total Current Liabilities 85.940 60.120 Long-Term Debt 122.000 119.62 Other Liabilities 21.880 22.58 Total Liabilities 229.820 202.320 Common Stock 200.380 160.32 Total Equity 200.38 160.32 Total Liabilities and Equity 430.200 362.640 INCOME STATEMENT 2021 Total Revenue (M) 488.10…SME Balance Sheet 2021 2020 Assets (in millions) Cash 85.960 56.460 Receivables 89.560 80.670 Inventories 55.750 41.260 Other Current Assets 9.950 6.760 Total Current Assets 241.220 185.150 Net Property, Plant, and Equipment 78.970 68.930 Goodwill and Other Intangible Assets 103.110 104.360 Other Non-Current Assets 6.900 4.200 Total Assets 430.200 362.640 Total Liabilities and Shareholders' Equity Payables 83.240 57.48 Current Debt 2.700 2.64 Total Current Liabilities 85.940 60.120 Long-Term Debt 122.000 119.62 Other Liabilities 21.880 22.58 Total Liabilities 229.820 202.320 Common Stock 200.380 160.32 Total Equity 200.38 160.32 Total Liabilities and Equity 430.200 362.640 INCOME STATEMENT 2021 Total Revenue (M) 488.10…SME Balance Sheet 2021 2020 Assets (in millions) Cash 85.960 56.460 Receivables 89.560 80.670 Inventories 55.750 41.260 Other Current Assets 9.950 6.760 Total Current Assets 241.220 185.150 Net Property, Plant, and Equipment 78.970 68.930 Goodwill and Other Intangible Assets 103.110 104.360 Other Non-Current Assets 6.900 4.200 Total Assets 430.200 362.640 Total Liabilities and Shareholders' Equity Payables 83.240 57.48 Current Debt 2.700 2.64 Total Current Liabilities 85.940 60.120 Long-Term Debt 122.000 119.62 Other Liabilities 21.880 22.58 Total Liabilities 229.820 202.320 Common Stock 200.380 160.32 Total Equity 200.38 160.32 Total Liabilities and Equity 430.200 362.640 INCOME STATEMENT 2021 Total Revenue (M) 488.10…
- SME Balance Sheet 2021 2020 Assets (in millions) Cash 85.960 56.460 Receivables 89.560 80.670 Inventories 55.750 41.260 Other Current Assets 9.950 6.760 Total Current Assets 241.220 185.150 Net Property, Plant, and Equipment 78.970 68.930 Goodwill and Other Intangible Assets 103.110 104.360 Other Non-Current Assets 6.900 4.200 Total Assets 430.200 362.640 Total Liabilities and Shareholders' Equity Payables 83.240 57.48 Current Debt 2.700 2.64 Total Current Liabilities 85.940 60.120 Long-Term Debt 122.000 119.62 Other Liabilities 21.880 22.58 Total Liabilities 229.820 202.320 Common Stock 200.380 160.32 Total Equity 200.38 160.32 Total Liabilities and Equity 430.200 362.640 INCOME STATEMENT 2021 Total Revenue (M) 488.10…SME Balance Sheet 2021 2020 Assets (in millions) Cash 85.960 56.460 Receivables 89.560 80.670 Inventories 55.750 41.260 Other Current Assets 9.950 6.760 Total Current Assets 241.220 185.150 Net Property, Plant, and Equipment 78.970 68.930 Goodwill and Other Intangible Assets 103.110 104.360 Other Non-Current Assets 6.900 4.200 Total Assets 430.200 362.640 Total Liabilities and Shareholders' Equity Payables 83.240 57.48 Current Debt 2.700 2.64 Total Current Liabilities 85.940 60.120 Long-Term Debt 122.000 119.62 Other Liabilities 21.880 22.58 Total Liabilities 229.820 202.320 Common Stock 200.380 160.32 Total Equity 200.38 160.32 Total Liabilities and Equity 430.200 362.640 INCOME STATEMENT 2021 Total Revenue (M) 488.10…SME Balance Sheet 2021 2020 Assets (in millions) Cash 85.960 56.460 Receivables 89.560 80.670 Inventories 55.750 41.260 Other Current Assets 9.950 6.760 Total Current Assets 241.220 185.150 Net Property, Plant, and Equipment 78.970 68.930 Goodwill and Other Intangible Assets 103.110 104.360 Other Non-Current Assets 6.900 4.200 Total Assets 430.200 362.640 Total Liabilities and Shareholders' Equity Payables 83.240 57.48 Current Debt 2.700 2.64 Total Current Liabilities 85.940 60.120 Long-Term Debt 122.000 119.62 Other Liabilities 21.880 22.58 Total Liabilities 229.820 202.320 Common Stock 200.380 160.32 Total Equity 200.38 160.32 Total Liabilities and Equity 430.200 362.640 INCOME STATEMENT 2021 Total Revenue (M) 488.10…
- SME Balance Sheet 2021 2020 Assets (in millions) Cash 85.960 56.460 Receivables 89.560 80.670 Inventories 55.750 41.260 Other Current Assets 9.950 6.760 Total Current Assets 241.220 185.150 Net Property, Plant, and Equipment 78.970 68.930 Goodwill and Other Intangible Assets 103.110 104.360 Other Non-Current Assets 6.900 4.200 Total Assets 430.200 362.640 Total Liabilities and Shareholders' Equity Payables 83.240 57.48 Current Debt 2.700 2.64 Total Current Liabilities 85.940 60.120 Long-Term Debt 122.000 119.62 Other Liabilities 21.880 22.58 Total Liabilities 229.820 202.320 Common Stock 200.380 160.32 Total Equity 200.38 160.32 Total Liabilities and Equity 430.200 362.640 INCOME STATEMENT 2021 Total Revenue (M) 488.10…SME Balance Sheet 2021 2020 Assets (in millions) Cash 85.960 56.460 Receivables 89.560 80.670 Inventories 55.750 41.260 Other Current Assets 9.950 6.760 Total Current Assets 241.220 185.150 Net Property, Plant, and Equipment 78.970 68.930 Goodwill and Other Intangible Assets 103.110 104.360 Other Non-Current Assets 6.900 4.200 Total Assets 430.200 362.640 Total Liabilities and Shareholders' Equity Payables 83.240 57.48 Current Debt 2.700 2.64 Total Current Liabilities 85.940 60.120 Long-Term Debt 122.000 119.62 Other Liabilities 21.880 22.58 Total Liabilities 229.820 202.320 Common Stock 200.380 160.32 Total Equity 200.38 160.32 Total Liabilities and Equity 430.200 362.640 INCOME STATEMENT 2021 Total Revenue (M) 488.10…Unusual income statement items Assume that the amount of each of the following items is material to the financial statements. Classify each item as either normally recurring (NR) or unusual (U) items. If unusual item, then specify if it is a discontinued operations item (DO). a. Interest revenue on notes receivable. b. Gain on sale of segment of the company's operations that manufactures bottling equipment. c.Loss on sale of investments in stocks and bonds. d. Uncollectible accounts expense. e. Uninsured flood loss. (Hood insurance is unavailable because of periodic Hooding in the area.)