2020 (The Base Year) Amount of physical capital (K) = 230,000 units Number of workers (L) = 100,000 persons Population = 348,800 persons %3D Population, and hence labor, grows at a rate of 5 percent per yea Capital depreciates at a rate of 15 percent per year. Capital Per worker = Average labor Productivity= Real GDP= Real GDP per capita=
2020 (The Base Year) Amount of physical capital (K) = 230,000 units Number of workers (L) = 100,000 persons Population = 348,800 persons %3D Population, and hence labor, grows at a rate of 5 percent per yea Capital depreciates at a rate of 15 percent per year. Capital Per worker = Average labor Productivity= Real GDP= Real GDP per capita=

Managerial Economics: Applications, Strategies and Tactics (MindTap Course List)
14th Edition
ISBN:9781305506381
Author:James R. McGuigan, R. Charles Moyer, Frederick H.deB. Harris
Publisher:James R. McGuigan, R. Charles Moyer, Frederick H.deB. Harris
Chapter7: Production Economics
Section: Chapter Questions
Problem 8E

Related questions
Question
1
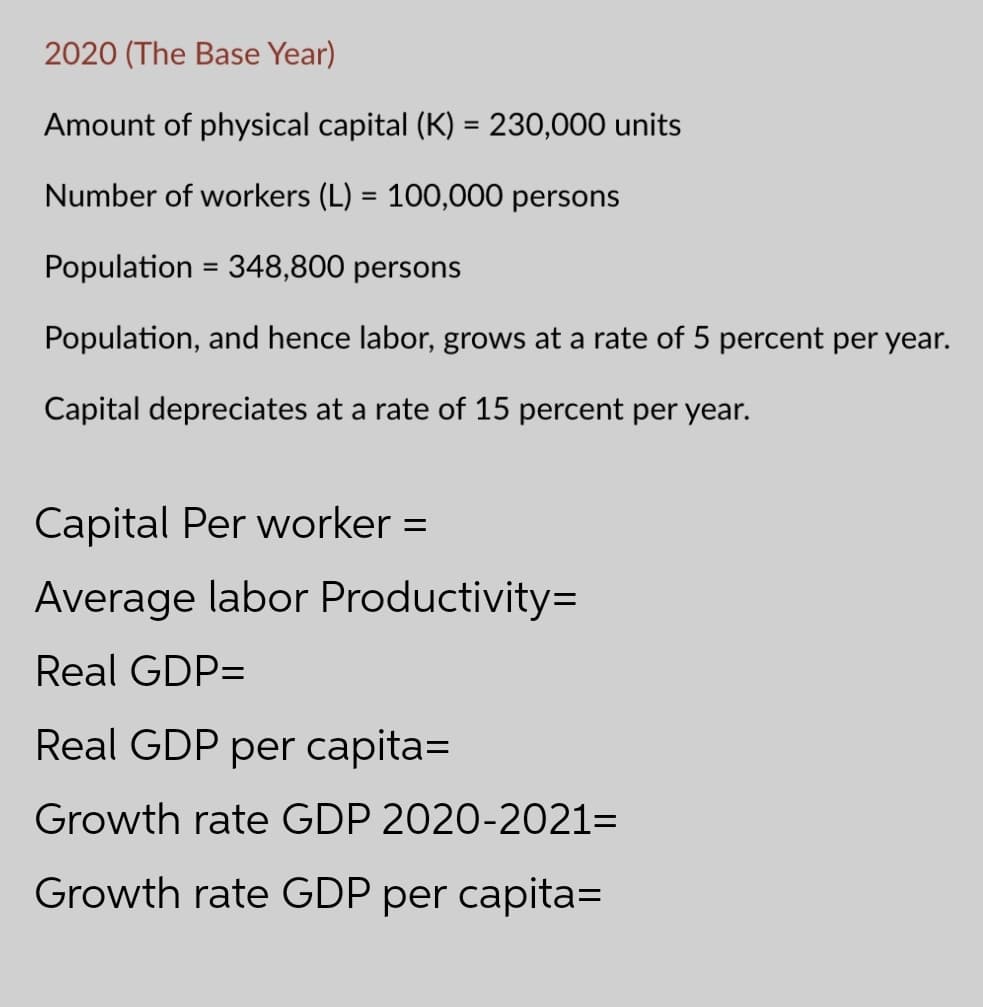
Transcribed Image Text:2020 (The Base Year)
Amount of physical capital (K) = 230,000 units
Number of workers (L) = 100,000 persons
Population = 348,800 persons
%3D
Population, and hence labor, grows at a rate of 5 percent per year.
Capital depreciates at a rate of 15 percent per year.
Capital Per worker =
Average labor Productivity=
Real GDP=
Real GDP per capita=
Growth rate GDP 2020-2021=
Growth rate GDP per capita=
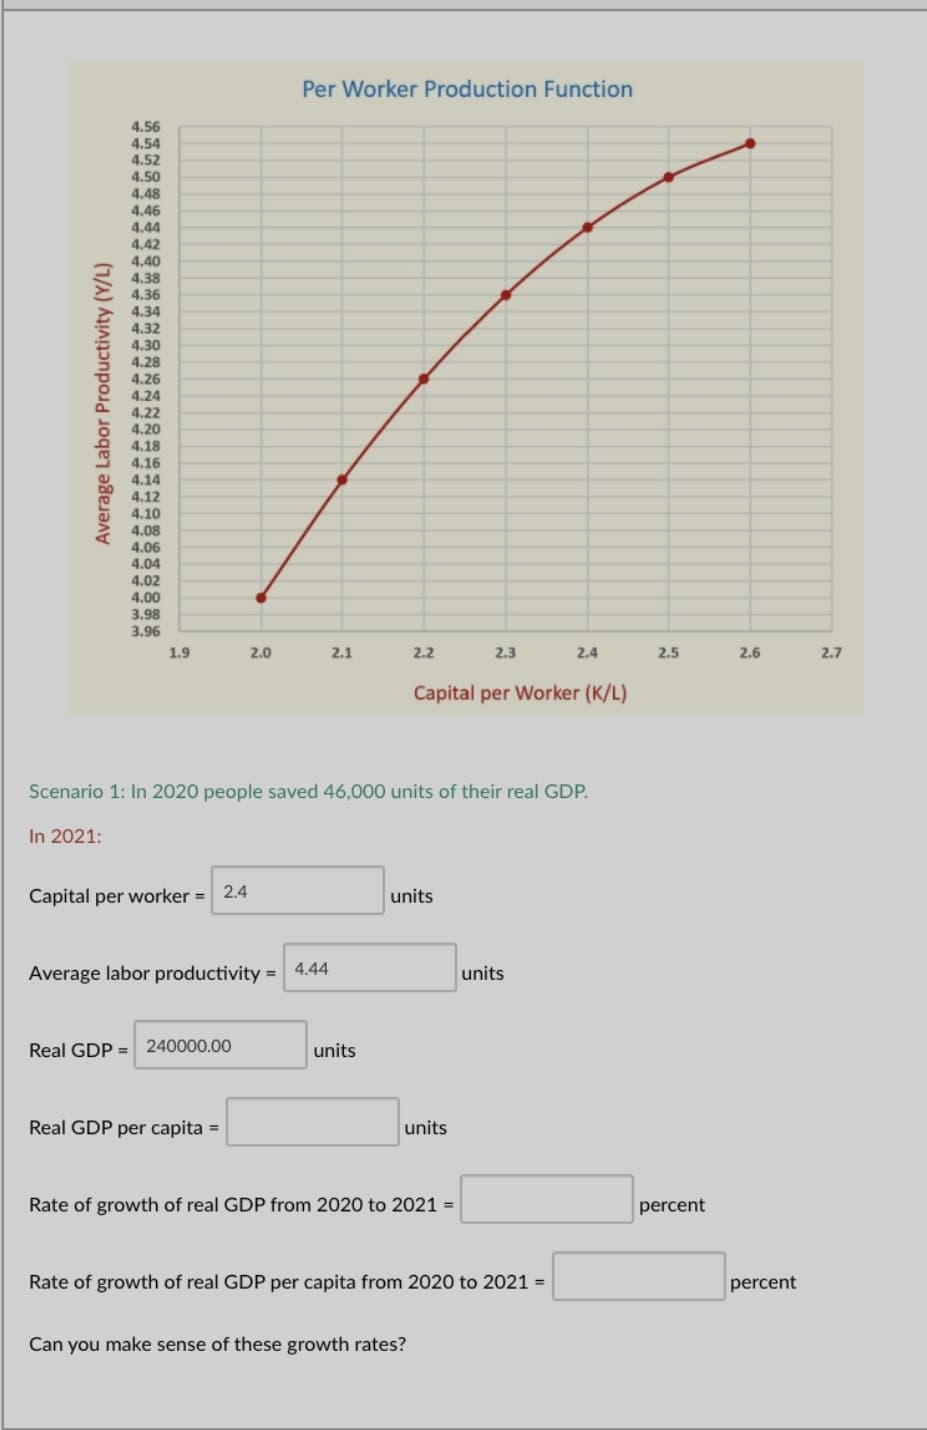
Transcribed Image Text:Per Worker Production Function
4.56
4.54
4.52
4.50
4.48
4,46
4,44
4.42
4.40
4.38
4.36
4.34
4.32
4.30
4.28
4.26
4.24
4.22
4.20
4.18
4.16
4.14
4.12
4.10
4.08
4.06
4.04
4.02
4.00
3.98
3.96
1.9
2.0
2.1
2.2
2.3
2.4
2.5
2.6
2.7
Capital per Worker (K/L)
Scenario 1: In 2020 people saved 46,000 units of their real GDP.
In 2021:
2.4
Capital per worker =
units
4.44
Average labor productivity =
units
Real GDP = 240000.00
units
Real GDP per capita =
units
Rate of growth of real GDP from 2020 to 2021 =
percent
Rate of growth of real GDP per capita from 2020 to 2021 =
percent
Can you make sense of these growth rates?
Average Labor Productivity (Y/L)
Expert Solution
This question has been solved!
Explore an expertly crafted, step-by-step solution for a thorough understanding of key concepts.

This is a popular solution!

Trending now
This is a popular solution!

Step by step
Solved in 2 steps with 2 images

Knowledge Booster


Learn more about
Need a deep-dive on the concept behind this application? Look no further. Learn more about this topic, economics and related others by exploring similar questions and additional content below.Recommended textbooks for you
Managerial Economics: Applications, Strategies an…
Economics
ISBN:
9781305506381
Author:
James R. McGuigan, R. Charles Moyer, Frederick H.deB. Harris
Publisher:
Cengage Learning

Managerial Economics: Applications, Strategies an…
Economics
ISBN:
9781305506381
Author:
James R. McGuigan, R. Charles Moyer, Frederick H.deB. Harris
Publisher:
Cengage Learning