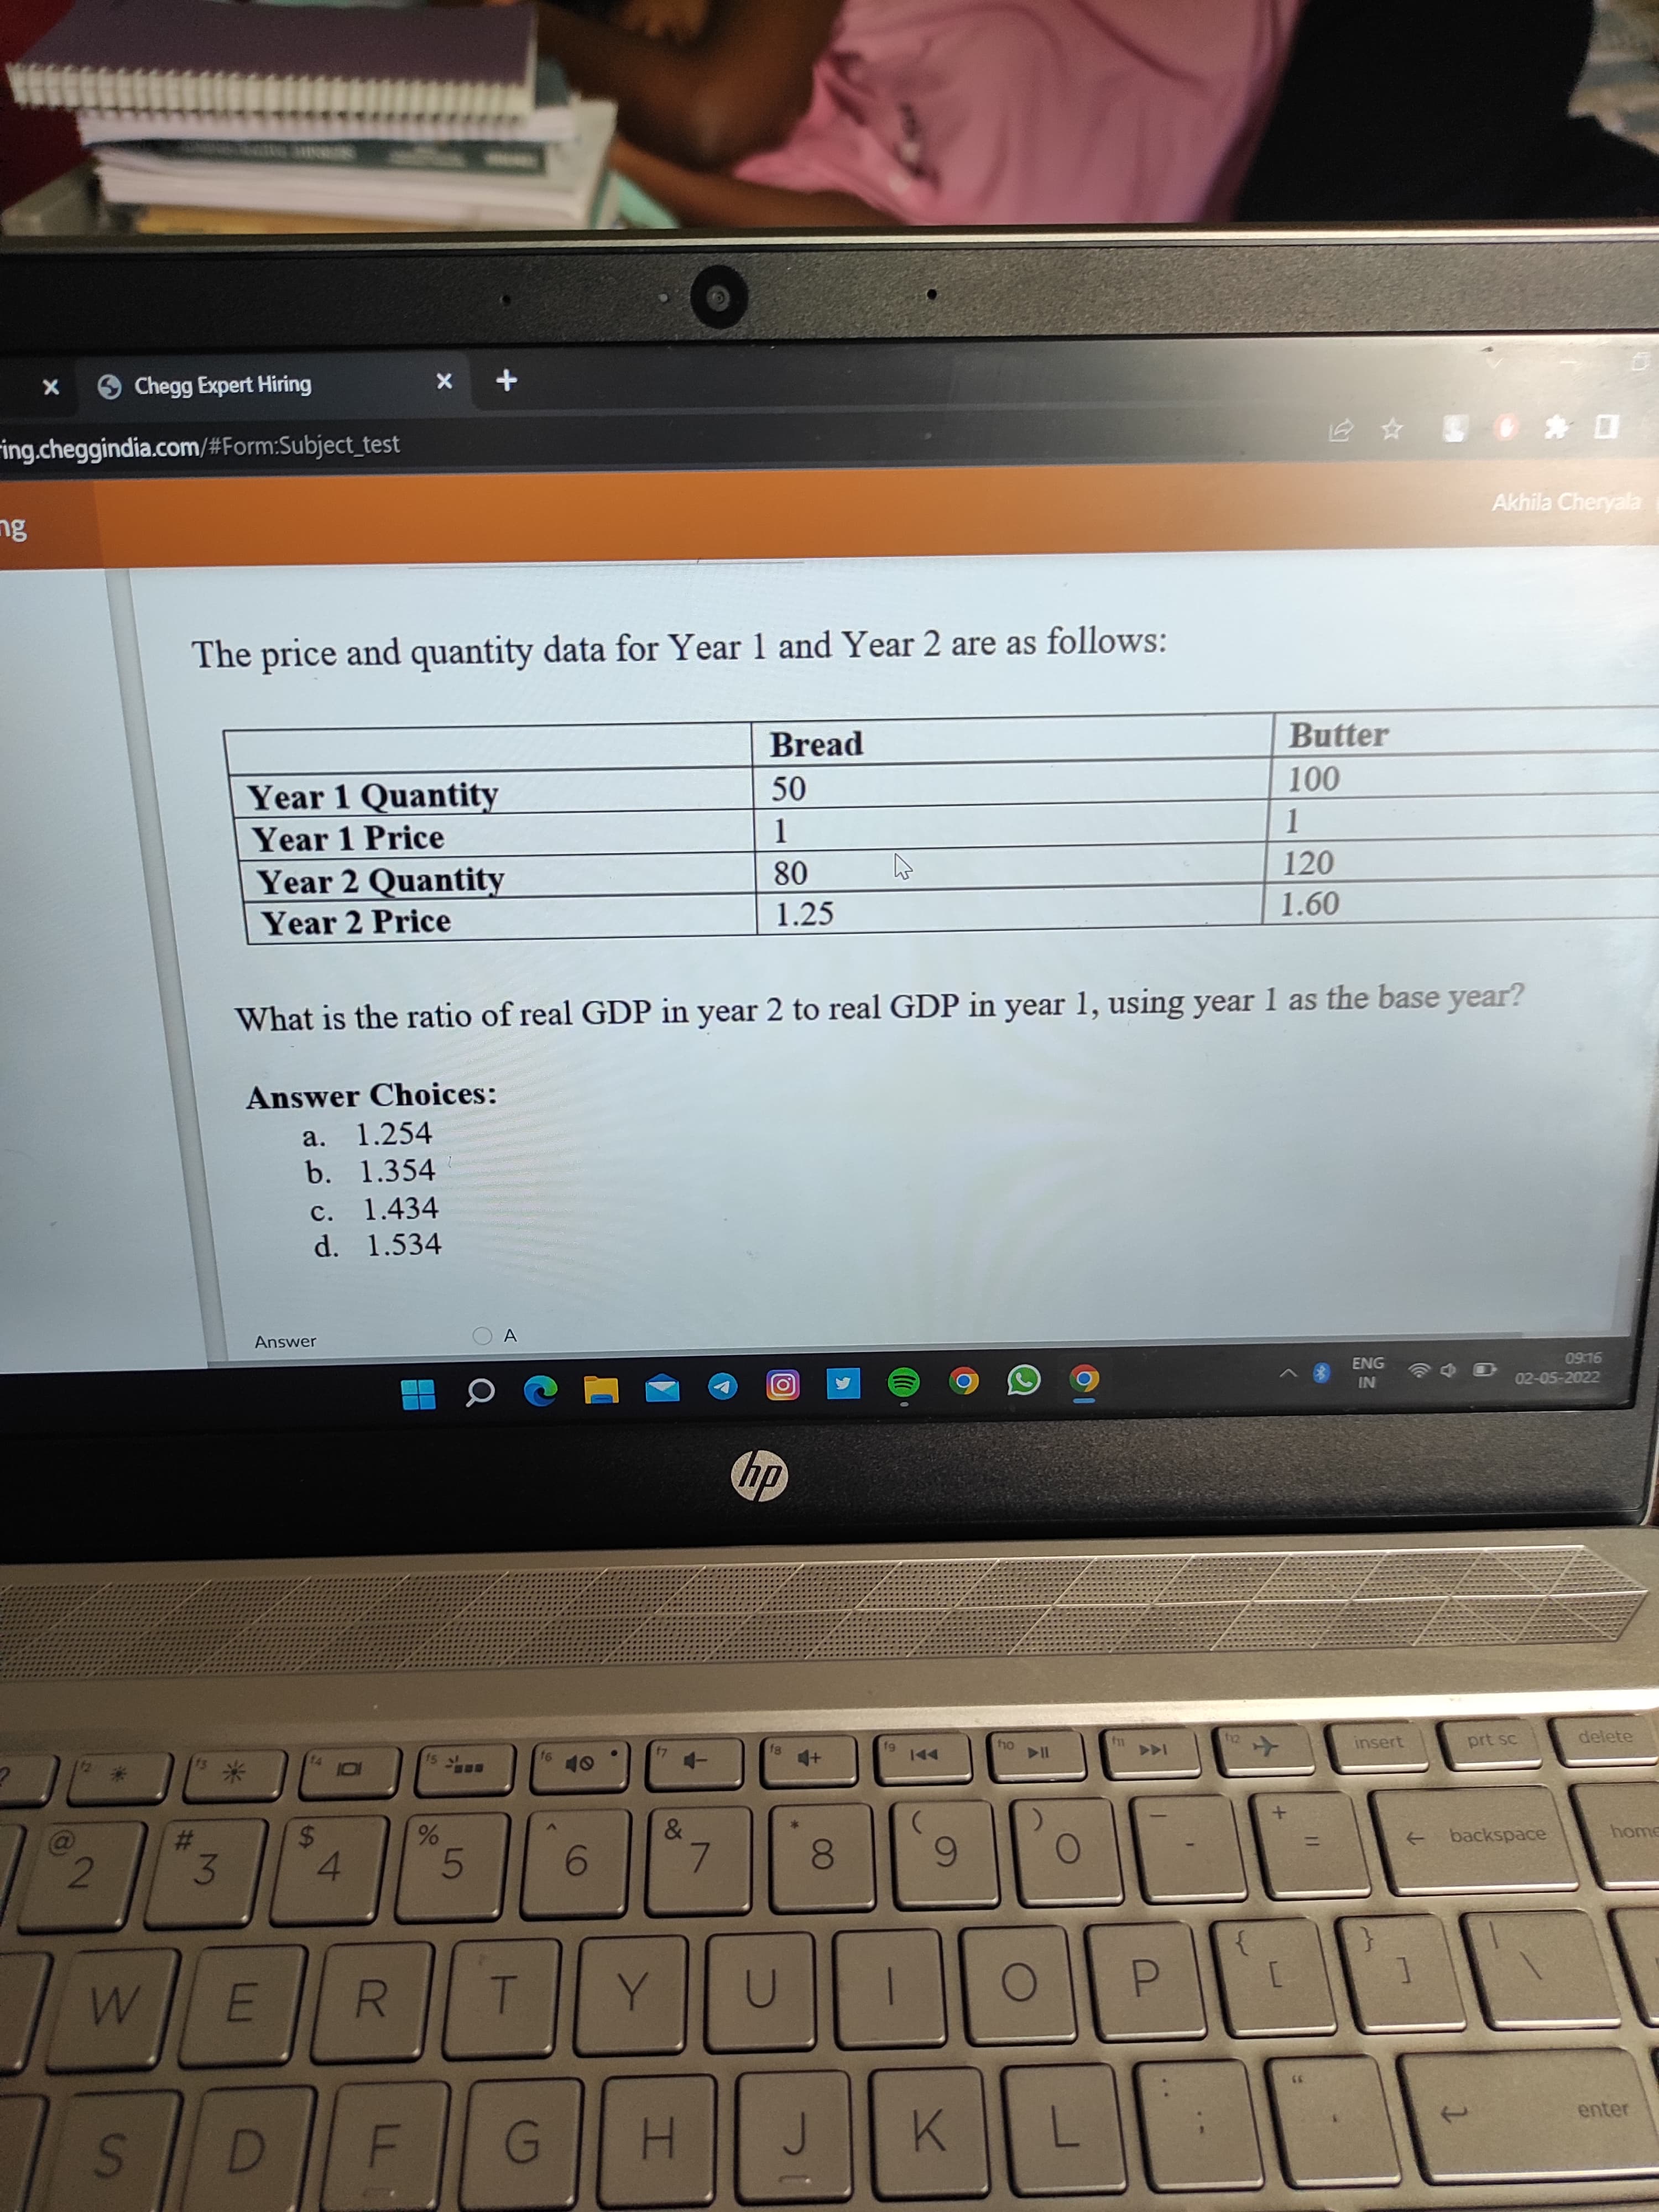
The price and quantity data for Year 1 and Year 2 are as follows: Bread Butter 100 50 Year 1 Quantity Year 1 Price 1 1 Year 2 Quantity 80 4 120 Year 2 Price 1.25 1.60 What is the ratio of real GDP in year 2 to real GDP in year 1, using year 1 as the base year? Answer Choices: a. 1.254 b. 1.354 c. 1.434 d. 1.534
Q: Questions 13: Please draw a PPF curve for the table to the right with labels? Batteries E
A: Since You have Posted Multiple questions, as per the guidelines we can solve only one question per…
Q: 5) (KEY QUESTION) Consider the following data assuming that these are the only products produced and…
A: Answer is given below
Q: ne . Question 1 Question 2 Question 3 O www.wa + 188 Price P P Slide 2 of 6 A ECO-205 As...) O'Neill…
A: Demand curve shows a negative relationship between price and quantity demanded. Supply curve shows a…
Q: Elasticity in the real world—sort of. The managers of a scholarly journal that I edit were thinking…
A: Elasticity is an economic term that describes how the aggregate quantity demanded of a good or…
Q: SLO-1.1. In centrally planned (command) economies the decides what goods and services will be…
A: There are different types of economies according to which people make their economic activities,…
Q: There are two consumers and two goods (A and B) in a competitive economy. At the competitive…
A: Individuals (consumers) directly involved in the acquisition, use, and disposal of economic goods…
Q: The interests of environmentalists and business are almost always directly opposed to each ot Being…
A: Business/corporate environmentalism includes the acknowledgment by firms that ecological issues…
Q: Can the exchange of personal-use property qualify as a like-kind exchange? Why or why not?
A: Asset of a similar nature: A like-kind asset isn't always the same as the item that would be…
Q: Suppose a discriminating monopolist is selling a product in four separate markets in which demand…
A: Given, the demands in the monopolistic firms: Q1 = 300 – P1; P1 = 300 - Q1 Q2 = 200 – 0.5P2; P2 =…
Q: The following table shows the outputs and prices of three products produced by an economy in 2018,…
A: To compute the GDP, we require to multiply the quantity of every product by its price and after…
Q: For some years, Mel has contracted with several major pizza retailers for home delivery services. He…
A: Given, New Van :Cost : 137,500 with economic life of 6 yearsTrade in value : 45,000AOC of…
Q: A firm has a short-run total cost function given as STC =q³5q² + 25q. a. If P = 100, identify the…
A: Answer; a) Profit maximising quantity , q = 15 Profit = 1125 b) Profit…
Q: (M/P) d=Y-20r. M = 600. P = 2. 1. What are the equilibrium level of income and the equilibrium…
A: The equilibrium level of income is the point at which a business is able to sell all of the goods it…
Q: 4. Working with Numbers and Graphs Q4 The face value of a bond is $6,000, and the annual coupon…
A: Answer; The coupon rate is 3%.
Q: One reason the CPI is monitored very closely by government, businesses, and workers is that Multiple…
A: Answer :- Option 2nd is correct :- Some wages, interest rates, tax rates, and government…
Q: Suppose demand for masks is Q-21-P. The supply of masks is Qs =2P Set QpQs and use algebra to find…
A: the equilibrium is at Qd=Qs 21-P=2P 3P=21 P=7 Q=2*7=14
Q: 5. If both income and price increase, the direction of the change in quantity demanded cannot be…
A: When there is a change in the price of the good, while other factors affecting demand remain the…
Q: The demand and supply curves of fire extinguishers are given by Qa= 10,000 - 10P and Qs = 15P,…
A: Given information Demand function Q=10000-10P Supply function Q=15P External benefit=$4
Q: 1. Draw five aggregate supply and demand graphs at long run equilibrium. Illustrate what would…
A: The aggregate demand–aggregate supply model, often known as the AD–AS model, is a macroeconomic…
Q: 3. Suppose there are two movie rental stores in town: Captain Video and Movie Mania. These movie…
A:
Q: If a firm can observe a buyer's characteristics then it can charge different prices as a function of…
A: The measure that depicts charging customers different prices for the same goods and services being…
Q: 4. An asset was acquired by Hugo and Sons with the following values: First cost= $400,000,…
A: * SOLUTION :- (10) Given that ,
Q: 7. Assume that the town citizen's have the right to free air and the factory does not have the right…
A: Since you have posted a question with multiple sub–parts, we will solve the first three sub-parts…
Q: "Vitamin Strong" has the geographically separated markets, denoted A and B. The demand on these two…
A: Given that, QA = 1-PA QB = 0.5 - PB
Q: 30 23 20 15 220 12 Price MC 15 ATC D 0 9 12 Quantity \MR Refer to Figure above. A profit-maximizing…
A: In a monopoly, marginal revenue lies below the demand curve because the seller has to decrease the…
Q: GMA will be visiting an automobile plant. It was decided by the plant management that they must…
A: Boysen Cost of Paint = 70 per gallon Covers = 350sq. ft per gallon time period = 5 years applied…
Q: Identify and discuss the micro environment factors that affects DHL express performance and decision…
A: The macro factors includes the conditions of a country and these conditions includes whether the…
Q: Which statement explains how people working in their own self-interest produce goods, services, and…
A:
Q: A building contractor can source door frames from either a nearby shop or a far-off forest area. The…
A: Solution:- Total reqquirent of wood = 75 tonnes For Nearby Shop:- Material cost/ton = $2,000…
Q: Quantity In reference to the above graph for an oligopolist. If the above firm at the point E in…
A: The kinked demand curve model explains the price rigidity observed in oligopolistic markets.
Q: To be classified as unemployed, a person must be at least 16 years old and trying to find a job…
A: By definition, an unemployed is classified as a person currently available for work and actively…
Q: Which of the following is a problematic feature of a welfare state that is mitigated by the…
A: A welfare state is one that is dedicated to providing its citizens with basic economic security by…
Q: discuss and analyze a current event in economics.
A: Economics is the study of the scarcity of resources and unlimited wants. The unlimited wants can be…
Q: to two decimal places. (a). The CPI (times 100) is 100 at the time that Frank makes the loan. It is…
A: Nominal rate of interest is the rate of interest where inflation has not been adjusted and real rate…
Q: Suppose that the central bank observed a drop in real GDP, but does not know what caused this drop.…
A: The real business cycle theory explains two major industries Money supply concepts include: The…
Q: The zones of the world economy as described by world-system theorists treat the North as a core and…
A: The reasons and primary determinants of economic development around the world are the focus of the…
Q: According to Keynesians, when should the federal government run a deficit and when should it run a…
A: The Keynesians recommend the active intervention of government in economic activities to deal with…
Q: 7) Refer to the graph below. Which move leads to a decrease in revenue? 11.0 100- a) The move from A…
A: (Since you have asked many questions, we will solve the first one for you. If you want any specific…
Q: agree rent Whas On renting my property of $10000 my دا for а principal over 5 years, r = 3% annually…
A:
Q: You can improve or damage your credit history with a credit card. O True O False
A: The economics as a study is based upon the idea that the resources which are present with each…
Q: Question 1 a. Draw a production possibilities curve for a hypothetical economy producing capital…
A: Hi! Thank you for the question As per the honor code, We’ll answer the first question since the…
Q: Deflation means prices are declining and is an indication that economic conditions are…
A: Answer :- The above statement is true. inflation means that prices are falling and it is an…
Q: Of the following countries, which is the most dependent on imported oil? a. Japan b. The…
A: petroleum-based industries portray a wide scope of regular hydrocarbon-based substances and refined…
Q: lgs Review view Help 5-7.D(x) = 2(x-3)² is the price, in dollars per unit, that consumers will pay…
A: * SOLUTION :-
Q: The marketing team of "Hi" restaurant reduced the price of their special triple-decker with double…
A: Break even point refers to a level of output at which the total cost of production of a firm is…
Q: Lotteries result in the distribution of income
A: Income Inequality is defined as the unequal distribution of income in an economy. It is the…
Q: Superconductor technology is becoming a widespread and indispensible component of the machines we…
A: Given, Superconductors play a vital role in the manufacturing of machines. They are found in each…
Q: High tax rates that put money into the government's funds tend to slow spending, and ultimately slow…
A: Tax: The word tax refers to the compulsory payment which is imposed by the government. It is also an…
Q: 3. Working with Numbers and Graphs Q3 The closing price of a stock is $75.95, and the net earnings…
A: Answer; The stock's P/E ratio is 24.
Q: Which of the following statements is true of a flexible exchange rate system? O A. Market forces…
A: A floating or flexible exchange rate is determined by the free forces of demand and supply of…
Trending now
This is a popular solution!
Step by step
Solved in 2 steps
- Show your work for the following questions.if nominal output rises from$240billion to $259 billion,and the GDP deflator rises from 100to105. a) what is the percentage increase in nominal output? b) what is the percentage increase in the price index? c) By how much does real output change? d) To what value would the deflator have had to rise for real income to remain constant? Please kindly answer all these questionsmagine an economy where the overall price level has been rising over the last twenty years. (No exceptions!) Which of the following statements would be correct for this economy?The nominal GDP must be larger than the real GDP for any given year in that twenty year period. The nominal GDP must be lower than the real GDP for any given year in that twenty year period. The growth rate of the nominal GDP must be lower than the growth rate of the real GDP for any given year in that twenty year period. The growth rate of the nominal GDP must be higher than the growth rate of the real GDP for any given year in that twenty year period.Year Units of Output Price Per Unit 1 8 $2 2 10 3 3 15 4 4 18 5 5 20 6 The accompanying table gives price and output data over a five-year period for an economy that produces only one good. If year 2 is the base year, then the percentage increase in real GDP from year 2 to year 4 is Group of answer choices 80 percent. 100 percent. 60 percent. 40 percent.
- Consider a simple economy that produces only three goods. Assume that all goods produced are consumed in same period (no inventories). Following table provides information on price and quantity produced and consumed of each of three goods: 2021 2021 2022 2022 Price Quantity Price Quantity Good 1 25 25 40 33 Good 2 45 45 60 35 Good 3 80 50 90 45 Calculate nominal and real GDP for both years using 2021 as the base year. Then calculate inflation rate derived from the GDP deflator and real GDP growth between 2021 and 2022. Calculate Consumer Price Index (CPI) for each year using share of consumption of each product in 2021 as a weight. Then find CPI inflation rate between 2021 and 2022. Is this inflation rate different from GDP deflator inflation rate? Discuss reasons for differences, if any. True, false or uncertain? Above results show that GDP deflator is worse than CPI for measuring changes in average prices in economy. Comment21 Macroeconomic Information for Mexico: 2020 Q2 GDP (in 2020 Q2 pesos) 4.97 trillion pesos 2020 Q1 GDP (in 2020 Q1 pesos) 6.09 trillion pesos 2020 Q2 GDP (in 2015 pesos) 3.76 trillion pesos 2020 Q1 GDP (in 2015 pesos) 4.54 trillion pesos Calculate Mexico's inflation, using the GDP deflator method, between the first and second quarters of 2020. (Enter your answer in percent form, rounded to one decimal place, without the percent sign. For example, if your answer is 0.12345, enter 12.3.)Consider the following table on Country X’s real gross domestic product (GDP) and population: 2019 2020 Real GDP $1,000,000 $1,100,000 Population 2,500 2,620 Required: Using the table above, determine the real GDP per person for 2019 and 2020 and the percentage change in real GDP per person from 2019 to 2020. Explain when an inflationary gap occurs. Explain when a recessionary gap occurs.
- Consider a Melanesian island nation in the South Pacific, which had a population of 0.88 million in 2010. The table below presents the nominal GDP and the GDP deflator (based on 2005 being the base year) for the years 2010, 2015 and 2020.YearNominal GDP ($millions)GDP Deflator201017500103.7201518222104.8202018755105.9Over each 5-year period, there were no significant changes to goverment policies or capital investment, and the country experienced a net migration of 0%. However, over the first five years (2010 to 2015), the growth rate of births was 12.5% while the growth rate of deaths was 7.5%. This resulted in a 5% population growth. Over the second five years (2015 to 2020), health care significantly improved such that the growth rate of births increased to 15% while the growth rate of deaths decreased to 5%. In 2010 employment population ratio is 64%. What is the real GDP per worker in 2010.Assume a hypothetical economy that produces only one good – Peanut Butter. In year 1, the quantity produced is 4 packs and the price is Rs.400 per pack. In year 2, the quantity produced is 5 packs and the price is Rs.500 per pack. In year 3, the quantity produced is 6 packs and the price is Rs.600 per pack. Year 1 is the base year. What is the percentage growth rate of real GDP from year 2 to year 3? What is the inflation rate as measured by the GDP deflator from year 2 to year 3? In this one-good economy, how might you have answered parts (d) and (e) without first answering parts (b) and (c)?In 2019, the population increases, and labor hours supplied increase by 10 at each real wage rate. What are the equilibrium real wage rate, labor productivity, and potential GDP in 2019? In 2019, the population increases, and labor hours supplied increase by 10 at each real wage rate. Does the standard of living in this economy increase in 2019? Explain why or why not. Suppose the following data describe a nation's population: Year 1 Year 2 Population 300 million 305 million Labor force 150 million 160 million Unemployed 7 million 7.2 million a. What is the unemployment rate in each year? How has the number of unemployed changed from year 1 to year 2 (must give the specific amount of change)? How is this apparent discrepancy between (a) and (b) explained?
- Consider a macroeconomy where the current population is 800 thousand people. Gross domestic private investment is constant $2500 million while consumer expenditure is described by the equation: C = 580+ 0.8DI. The government is fairly active, with a total expenditure of $2000 million and net taxes of $2550 million. Further investigation of the macroeconomy reveals that imports are constant at $3000 million while exports are constant at $2500 million. Currently, the overall price level (GDP deflator) is 118 and the potential GDP level is $13.5 billion. What is the current equilibrium level of real GDP? (report your answer at 2 decimal places and in millions of dollars) 1. What is the current equilibrium level of real GDP 2. what is the current real GDP per capita? 3. what is the value gap?So far, we have learned to measure real GDP, but how do we end up with that real GDP? Of all of the different amountsof national income and price levels that might exist, how do we gravitate toward the one that gets measured each year asreal GDP?In short, it is the interaction of the buyers and producers of all output that determines both the national income (real GDP)and the price level. In other words, the intersection of aggregate demand (AD) and short-run aggregate supply (SRAS)determines the short-run equilibrium output and price level.Once we have a short-run equilibrium output, we can then compare it to the full employment output to figure out where inthe business cycle we are. If current real GDP is less than full employment output, an economy is in a recession. If currentreal GDP is higher than full employment output, an economy is experiencing a boom. If the current output is equal to thefull-employment output, then we say that the economy is in long-run equilibrium. The…The following table contains nominal and real GDP data, in billions of dollars, from the U.S. Bureau of Economic Analysis for 2013 and 2014. The data is listed per quarter, and the real GDP data was calculated using 2009 as the base year. Fill in the columns for the GDP deflator and for the percent increase in price level. (Round your responses to two decimal places!) Quarter Nominal GDP Real GDP GDP Deflator Percent Increase in Price Level (%) 2013 Q1 16,502.40 15,538.40 106.20 ---- 2013 Q2 16,619.20 15,606.60 ? ? 2013 Q3 16,872.30 15,779.90 ? ? 2013 Q4 17,078.30 15,916.20 ? ? 2014 Q1 17,044.00 15,831.70 ? ? 2014 Q2 17,328.20 16,010.40 ? ? 2014 Q3 17,599.80 16,205.60 ? ? 2014 Q4 17,703.70 16,294.70 ? ? Please explain how to solve the empty columns thank you!