-20Υ8 Return on total assets 24.4% Return on stockholders' equity 50.1% Times interest earned 4.6
-20Υ8 Return on total assets 24.4% Return on stockholders' equity 50.1% Times interest earned 4.6

Survey of Accounting (Accounting I)
8th Edition
ISBN:9781305961883
Author:Carl Warren
Publisher:Carl Warren
Chapter9: Metric-analysis Of Financial Statements
Section: Chapter Questions
Problem 9.4.3P: Twenty metrics of liquidity, solvency, and profitability The comparative financial statements of...

Related questions

Topic Video
Question
100%
Please answer all parts with explanations thx also need times interest earned for 2014- 2018 and ratio of liabilities to stockholders equity for 2014-2018
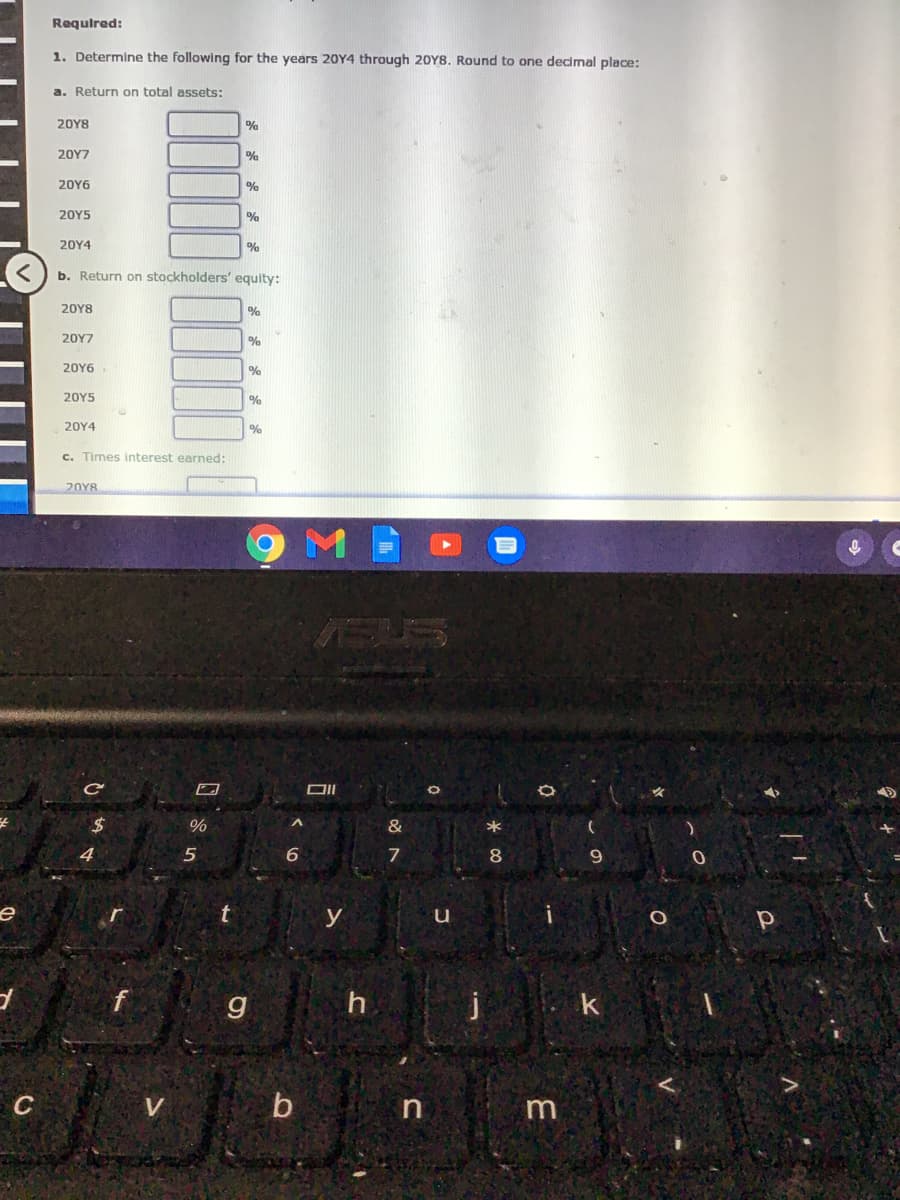
Transcribed Image Text:Requlred:
1. Determine the following for the years 20Y4 through 20Y8. Round to one decimal place:
a. Return on total assets:
20Y8
%
20Υ7
20Υ6
20Y5
20Υ4
%
b. Return on stockholders' equity:
20Υ8
20Υ7
20Y6
%
20Y5
%
20Y4
%
c. Times interest earned:
20Y8
EUS
$4
%
&
*
5
6.
7
8
9.
t
y
C
m
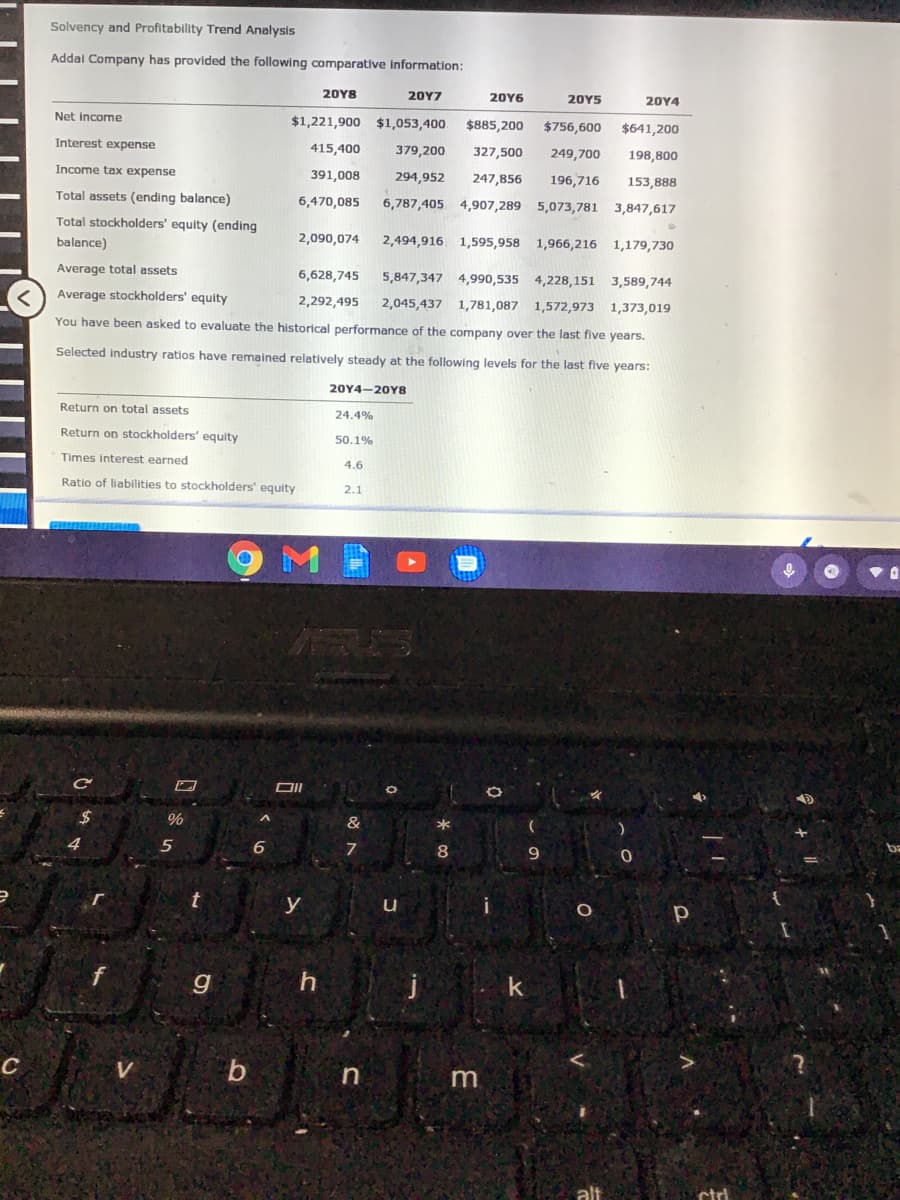
Transcribed Image Text:Solvency and Profitability Trend Analysis
Addal Company has provided the following comparative information:
20Y8
20Υ7
20Y6
20Y5
20Y4
Net income
$1,221,900 $1,053,400.
$885,200
$756,600
$641,200
Interest expense
415,400
379,200
327,500
249,700
198,800
Income tax expense
391,008
294,952
247,856
196,716
153,888
Total assets (ending balance)
6,470,085
6,787,405 4,907,289 5,073,781 3,847,617
Total stockholders' equity (ending
balance)
2,090,074
2,494,916 1,595,958 1,966,216 1,179,730
Average total assets
6,628,745
5,847,347 4,990,535 4,228,151
3,589,744
Average stockholders' equity
2,292,495
2,045,437 1,781,087 1,572,973 1,373,019
You have been asked to evaluate the historical performance of the company over the last five years.
Selected industry ratios have remained relatively steady at the following levels for the last five years:
20Υ4-20Υ8
Return on total assets
24.4%
Return on stockholders' equity
50.1%
Times interest earned
4.6
Ratio of liabilities to stockholders' equity
2.1
$4
&
6.
7
8
9
y
k
m
ctrl
Expert Solution
This question has been solved!
Explore an expertly crafted, step-by-step solution for a thorough understanding of key concepts.

Step by step
Solved in 4 steps with 11 images

Knowledge Booster


Learn more about
Need a deep-dive on the concept behind this application? Look no further. Learn more about this topic, accounting and related others by exploring similar questions and additional content below.Recommended textbooks for you
Survey of Accounting (Accounting I)
Accounting
ISBN:
9781305961883
Author:
Carl Warren
Publisher:
Cengage Learning

Managerial Accounting: The Cornerstone of Busines…
Accounting
ISBN:
9781337115773
Author:
Maryanne M. Mowen, Don R. Hansen, Dan L. Heitger
Publisher:
Cengage Learning

Fundamentals of Financial Management (MindTap Cou…
Finance
ISBN:
9781337395250
Author:
Eugene F. Brigham, Joel F. Houston
Publisher:
Cengage Learning
Survey of Accounting (Accounting I)
Accounting
ISBN:
9781305961883
Author:
Carl Warren
Publisher:
Cengage Learning
Managerial Accounting: The Cornerstone of Busines…
Accounting
ISBN:
9781337115773
Author:
Maryanne M. Mowen, Don R. Hansen, Dan L. Heitger
Publisher:
Cengage Learning
Fundamentals of Financial Management (MindTap Cou…
Finance
ISBN:
9781337395250
Author:
Eugene F. Brigham, Joel F. Houston
Publisher:
Cengage Learning


College Accounting, Chapters 1-27
Accounting
ISBN:
9781337794756
Author:
HEINTZ, James A.
Publisher:
Cengage Learning,