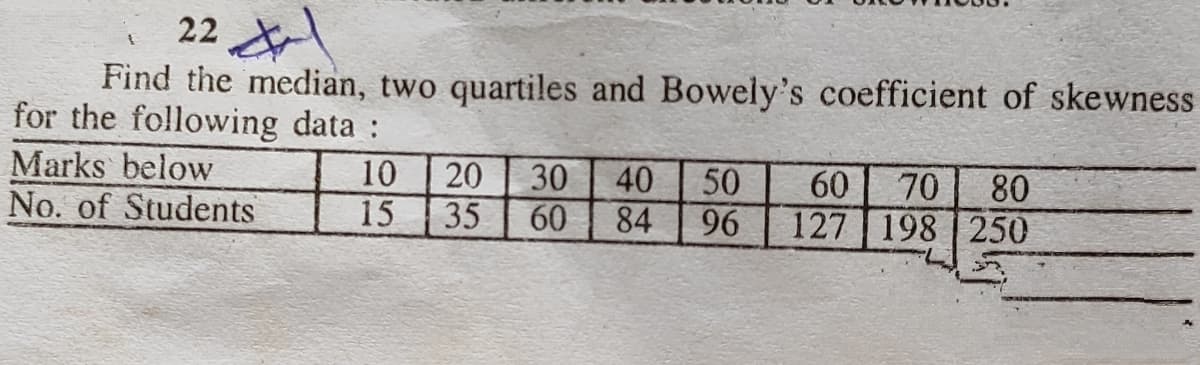
22 Find the median, two quartiles and Bowely's coefficient of skewness or the following data : farks below lo. of Students 10 20 30 40 50 60 70 80 15 35 60 84 96 127 198 250


Q: Calculate coefficient of skewness based on quartiles and median from the following data: Variable…
A:
Q: Consider the following dataset: 8 24 27 77 81 92 97 97 98 Find the percentile…
A:
Q: 1. Given the data: 29.65 28.55 28.65 30.15 29.35 29.75 29.25 30.65 28.15 29.85 29.05 30.25 30.85…
A: “Since you have posted a question with multiple sub-parts, we will solve first three subparts for…
Q: 1. The following are the number of minutes spent shopping by 10 randomly selected customers in a…
A: As per bartleby guideline expert have to answer first three subparts only dear student please…
Q: The ages of the 36 millionaires sampled are arranged in increasing order in the following table (can…
A:
Q: Given the following data set: 33 27 21 41 27 45 52 49 36 41 The Inter-quartile Range (IQR) is:…
A:
Q: Find the median, lower and upper quartiles from the following tabie : Marks No. of students Below 10…
A:
Q: 2. The following are the scores in Math of the sampled 15 Grade 10 students: 60 61 58 70 62 74 75 78…
A:
Q: The following set of data is from a sample of n= 6. 8 7 2 8 6 12 0 a. Compute the mean, median, and…
A: The variance can be calculated as follows: Step 1: Put the data onto the excel spreadsheet Step 2:…
Q: The following data related the rubber percentage of two types of rubber plants, where the sample…
A: Given that We have to conduct hypothesis testing for difference of two population means :
Q: Q) Consider the following data: 62 61 83 92 67 89 83 50 80 69 95…
A: Note: Since you have posted a question with multiple sub-parts, we will solve first three sub-parts…
Q: Consider the bivariate dataset for variable Louisiana, (X) and variable South Dakota, (Y) given by…
A: The independent variable is Louisiana. The dependent variable is South Dakota. This is simple linear…
Q: Find the mean, the median, and the mode(s), if any, for the given data. Round noninteger means to…
A: Given data are -8.1,-2.4,4.5,4.5,6.2,8.9,9.9 To find Mean, median and mode. Solution: Mean is the…
Q: From a box and whisker diagram which one of the following can not be seen or computed Select one:…
A: From box and whiskers diagram We can calculate Minimum, First quartile (Q1), Median,Third quartile…
Q: (a) Consider the following set of a sample data: 320 320 330 320 320 330 500 320 320 310 300 320 320…
A:
Q: The following set of data is from a sample of n=6. 6 59 6 3 13 O a. Compute the mean, median, and…
A: Since you have posted a question with multiple sub-parts, we will solve first three sub-parts for…
Q: Test the following data to see if the mean high temperature (in Fahren- heit) in Cabanatuan is…
A: Test the mean high temperature, Cabanatuan is higher than the mean high temperature in Fahrenheit…
Q: Let Q1 represent the first quartile, Q2 represent the second quartile (or median), and Q3 represent…
A: Quartiles: It is the group of values or means that divide a data set into quarters or groups of…
Q: (2) A sample of high school teachers yields the following data on the number of years of teaching…
A:
Q: oblem No. 8 e following data show the ages of the randomly selected players of the 2021 Squid ame…
A: # given : data values having sample size n=25 in arranged order then To find 1): mean 2): median…
Q: The following data set refers to the number,of customers per day at a store in a mall during a…
A: Given data, 31,52,90,41,66,68,41,64,52,32,56,75,77,78,20,33,36,32,48,59 Sort the data in ascending…
Q: In a study of milk production in sheep (for use in making cheese), a researcher measured the 3-month…
A: Given Information: Number of observations = 11 The yields were as follows: 56.5, 89.8, 110.1, 65.6,…
Q: 6. FILE Determine the median and the first and third quartiles in the following data 5.24 6.02 6.67…
A: Use EXCEL Procedure to obtain the value of median Follow the instruction to obtain the value of…
Q: (b) Find the median from the following data Class 0-10 10- 20 20-30 30 - 40 40 - 50 Frequency 6 12…
A: Median divides the observations in two equal parts in such a way that the number of observations…
Q: 1. The following data are the scores of the 15 Grade 8 students in their Mathematics exam. 30 14 18…
A: To find: Mean Median Mode Formulas: Meanx=∑xn , n=Total number Median = Middle Value of the Ordered…
Q: Here are a few summary statistics about the data: Sample size Sample SD Sample Sample median mean…
A: f) From the table the sample means are 594.30 and 405.60.
Q: 3. Find out the value of quartile deviation and its coefficient from the following data Roll No. 3…
A:
Q: Q5 Calculate Quartile Deviation and its Coefficient from the following data Weight (in pounds) 120…
A:
Q: The following set of data is from a sample of n=6. 6 59 6 3 13 O a. Compute the mean, median, and…
A: a. given data sample 6, 5, 9, 6, 3, 13 Mean = (sum of observations)/(Number of observations) Mean =…
Q: The following dataset represents the number of passengers getting on the subway for 36 subway stops,…
A: Given data,…
Q: Below are the ages of 36 passengers oI the Titanic. 47 62 27 22 14 30 26 18 21 23 63 47 24 35 21 27…
A: Given
Q: . Consider three groups of employees who are exposed to three different methods of managing…
A: For Group A : XXA XA2 75 5625 80 6400 95 9025 80 6400 85 7225 Sum = 415 Sum = 34675…
Q: Compute for the following with regards to the data below; A. skewness coefficient using Pearson's…
A:
Q: Test the following data to see if the mean high temperature (in Fahrenheit) in Japan is higher than…
A: Given, Test the following data to see the mean high temperature in Japan is higher than the mean…
Q: 1) Given the following dataset which represents a sample ( n = 8) from a larger population: 88 123…
A: From the given information, number of observations is 8. These observations were drawn from a larger…
Q: Find the mean, median, and mode for the following data set: 12 27 26 27 25 Find the mean madion ond…
A: As per Bartleby guideline expert have to answer first question only dear student please upload other…
Q: the serum HDL c women. Following is a sample of 36 HDL levels (in based on the results of that…
A: Hi! Thank you for the question, As per the honour code, we are allowed to answer three sub-parts at…
Q: Find the mean, median and mode, Q1, Q3, De and P of the following grouped data. 2. Cost of printing…
A: Given data is Data Frequency 50-65 19 66-81 13 82-97 38 98-113 24…
Q: 1. The following data are the protein content of bean. 159 338 657 259 276 386 179 229 742 149 408…
A: Use the given data to form the excel table: x x-x¯ x-x¯2 159 -180.8 32688.64…
Q: Calculate Quartile Deviation and its Coefficient from the following data : Weight (in pounds) 120…
A:
Q: The following data gives the scores of 13 students in a Biostatistics exam. 75 80 28 70 95 82 75 64…
A: Hello! As you have posted more than 3 sub parts, we are answering the first 3 sub-parts. In case…
Q: 8 The following table shows the marks of 120 students. Marks 0<xs 20 20 <x< 40 40<x< 60 60 <x< 80…
A: Since you have posted a question with multiple sub-parts, we will solve first three sub-parts for…
Q: Calculate Quartile Deviation and its Coefficient from the following data : Weight (in pounds) 120…
A:
Q: In a study of milk production in sheep (for use in making cheese), a researcher measured the…
A: Arrange the observations in increasing order as follows: 44.4, 56.5, 63.7, 65.6, 75.1, 82.6, 89.8,…
Q: 6. The following data is given: Number of animals 15 5 5 Average Domestic animals 2 Types of Animals…
A: Types of Animal n x s s2 Dogs 5 2 1 1 Cats 5 3 1.87 3.4969 Hamster 5 4 1.41 1.9881 p = 3 n…
Q: 5. The following table shows the number of prescription a doctor wrote each day for a tuberculosis…
A: Since you have asked multiple questions,we will solve the first question for you.If you want any…
Q: Use the following Boxplot to answer the following question: 25 50 75 100 125 150 175 200 225 250 275…
A: The box plot:
Q: 2. Construct an Ungrouped Frequency on the data below. Attitudes Racial or Ethnic Group Marital…
A: Given Information:
Q: Find the mean of each sample. Round each answer to two decimal places. Sample A (in cubic…
A:
Q: The mean of the dataset is equal to: * The data below represents the ages of a sample of individuals…
A: Given that data 11, 3, 15, 22, 26, 28, 15, 11, 6, 11, 4, 22, 5 Mean = sum of all observations/total…

Step by step
Solved in 6 steps with 6 images
