3. Find out the value of quartile deviation and its coefficient from the following data Roll No. 3 4. 5. Marks 20 28 40 12 30 15 50 addy d nwode asw dI 1
3. Find out the value of quartile deviation and its coefficient from the following data Roll No. 3 4. 5. Marks 20 28 40 12 30 15 50 addy d nwode asw dI 1

Glencoe Algebra 1, Student Edition, 9780079039897, 0079039898, 2018
18th Edition
ISBN:9780079039897
Author:Carter
Publisher:Carter
Chapter10: Statistics
Section10.5: Comparing Sets Of Data
Problem 13PPS

Related questions
Question
Transcribed Image Text:the following data
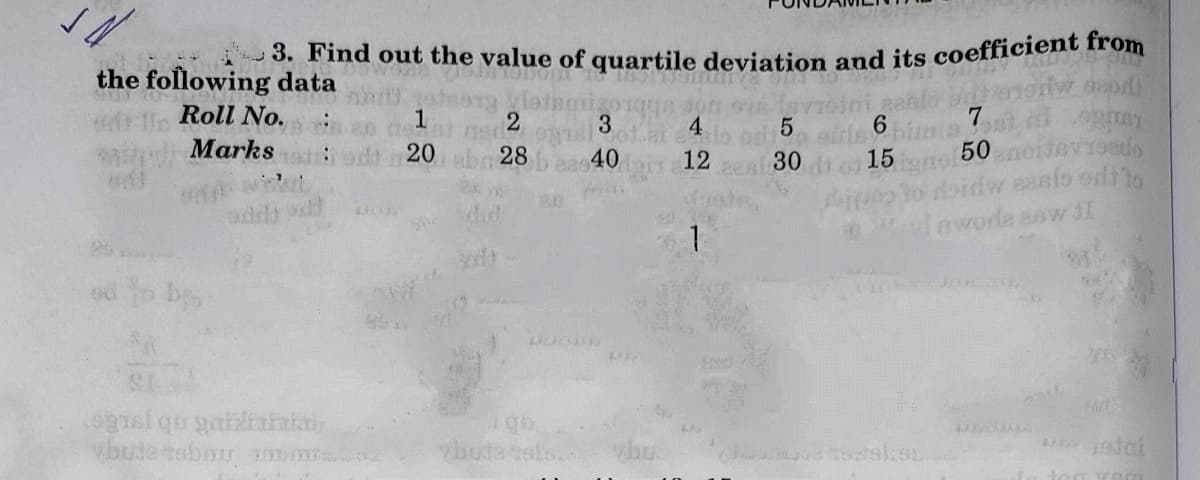
3. Find out the value of quartile deviation and its coefficient from
Roll No.
Marks
3
4
20
28
40
12
30
15
did
S
nwode asw dI
od o b
huda tebou
Expert Solution
This question has been solved!
Explore an expertly crafted, step-by-step solution for a thorough understanding of key concepts.

This is a popular solution!

Trending now
This is a popular solution!

Step by step
Solved in 2 steps with 2 images

Recommended textbooks for you
Glencoe Algebra 1, Student Edition, 9780079039897…
Algebra
ISBN:
9780079039897
Author:
Carter
Publisher:
McGraw Hill
Glencoe Algebra 1, Student Edition, 9780079039897…
Algebra
ISBN:
9780079039897
Author:
Carter
Publisher:
McGraw Hill