22. Ages from a random sample of 18 athletes in the 2012 London Olympics is provided below. Ages are from athletes across any of the events. Calculate the following summary statistics to explore the distribution of ages for Olympic athletes. 21, 22, 26, 24, 32, 21, 21, 20, 22, 31, 34, 23, 27, 26, 29, 20, 22, 29 (a) Find the mean and median of the data. (b) Based on the mean and median, what can be said about the likely shape of the data? Does this make sense given the setting for the data? Explain. (c) Which of the two measures of center is more appropriate for this data? Explain. (d) Find the standard deviation and IQR of the the data using the calculator. (e) Which of the two measures of spread is most appropriate for the data? Explain.
22. Ages from a random sample of 18 athletes in the 2012 London Olympics is provided below. Ages are from athletes across any of the events. Calculate the following summary statistics to explore the distribution of ages for Olympic athletes. 21, 22, 26, 24, 32, 21, 21, 20, 22, 31, 34, 23, 27, 26, 29, 20, 22, 29 (a) Find the mean and median of the data. (b) Based on the mean and median, what can be said about the likely shape of the data? Does this make sense given the setting for the data? Explain. (c) Which of the two measures of center is more appropriate for this data? Explain. (d) Find the standard deviation and IQR of the the data using the calculator. (e) Which of the two measures of spread is most appropriate for the data? Explain.

Glencoe Algebra 1, Student Edition, 9780079039897, 0079039898, 2018
18th Edition
ISBN:9780079039897
Author:Carter
Publisher:Carter
Chapter10: Statistics
Section: Chapter Questions
Problem 25SGR

Related questions
Topic Video
Question
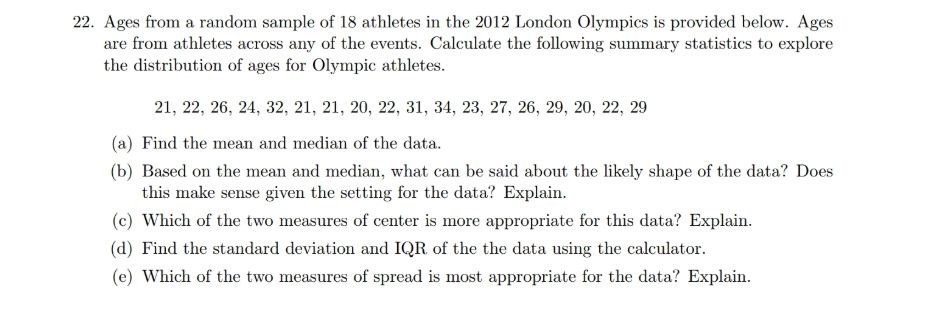
Transcribed Image Text:22. Ages from a random sample of 18 athletes in the 2012 London Olympics is provided below. Ages
are from athletes across any of the events. Calculate the following summary statistics to explore
the distribution of ages for Olympic athletes.
21, 22, 26, 24, 32, 21, 21, 20, 22, 31, 34, 23, 27, 26, 29, 20, 22, 29
(a) Find the mean and median of the data.
(b) Based on the mean and median, what can be said about the likely shape of the data? Does
this make sense given the setting for the data? Explain.
(c) Which of the two measures of center is more appropriate for this data? Explain.
(d) Find the standard deviation and IQR of the the data using the calculator.
(e) Which of the two measures of spread is most appropriate for the data? Explain.
Expert Solution
This question has been solved!
Explore an expertly crafted, step-by-step solution for a thorough understanding of key concepts.

This is a popular solution!

Trending now
This is a popular solution!

Step by step
Solved in 3 steps with 3 images

Knowledge Booster


Learn more about
Need a deep-dive on the concept behind this application? Look no further. Learn more about this topic, statistics and related others by exploring similar questions and additional content below.Recommended textbooks for you
Glencoe Algebra 1, Student Edition, 9780079039897…
Algebra
ISBN:
9780079039897
Author:
Carter
Publisher:
McGraw Hill
Glencoe Algebra 1, Student Edition, 9780079039897…
Algebra
ISBN:
9780079039897
Author:
Carter
Publisher:
McGraw Hill