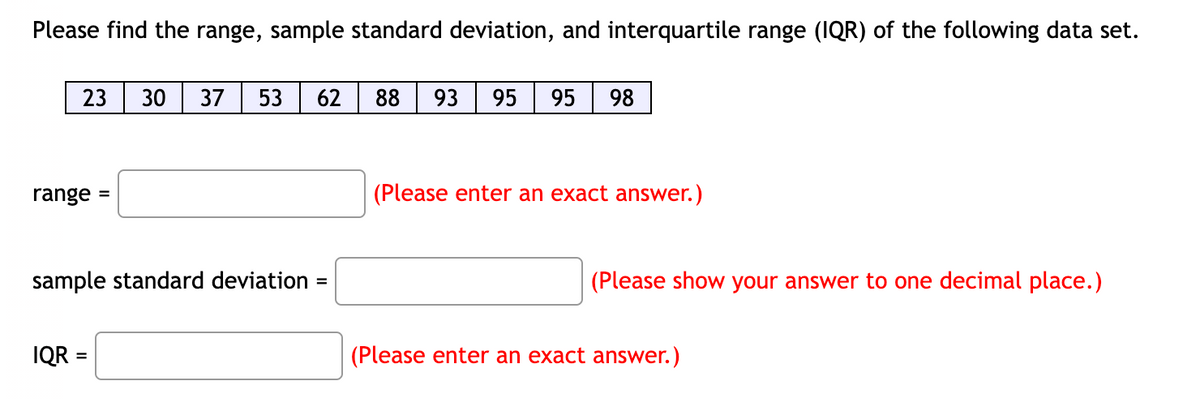
23 30 37 53 62 ange = ample standard deviation = 88 93 95 95 98 (Please enter an exact answer.) (Please show your


Q: Consider the table below: Classes Frequency, (Mass) (kg) 30.00 < 40.00 40.00 < 50.00 50.00< 60.00…
A: Variance is the measure of dispersion. It explain the spread of each data from the mean. It is…
Q: The relative frequency % of motorcyclist's aged between 43 and 70 who were fatally injured in…
A: It is given that the ages of a random sample of motorcyclists when they were fatally injured in…
Q: Dr. Smith initially decides to curve the class scores according to the following criteria relative…
A: Given Information: Mean μ=78 Standard deviation σ=8
Q: Determine the probability density function for the following cumulative distribution function. F(x)…
A: Introduction: It is required to obtain the probability density function, fx for the given cumulative…
Q: What is the probability of obtaining two heads in a row when flipping a coin? Interpret this…
A: Introduction The probability shows how likely an event will occur.
Q: The joint pdf of the random variable X and Yis given in the below matrix. Find the mean value of X…
A: Given that We have to calculate the mean of X and mean of Y:
Q: A survey asked senior executives at large corporations their opinions about the economic outlook for…
A: Hint: The 1001-α% confidence interval for the difference between the two proportions is given by,…
Q: distribution of means would be more likely to have ___________ compared to a distribution of raw…
A: Given that A distribution of means would be more likely to have ( ) compared to a distribution of…
Q: Individuals in the study who fell asleep fewer than 3 times during the observation period are…
A: The objective is to identify the appropriate measure that would explain the proportion of the…
Q: A Shapiro-Wilk 0.05. Which of the following is best? statements O O result had a p-value of O There…
A: Shapiro-Wilk test is used to test the normality of sample. The null hypothesis in this test is that…
Q: (A) Usually, p-values LESS THAN 0.05 means that our studies are significant. (B) However,…
A: Given: Statement A - Usually p-values less than 0.05 means that our studies are significant.…
Q: A survey was conducted about real estate prices. Data collected is 148216, 201866, 352428, 481312,…
A: Since you have asked multiple questions, we will solve the first question for you. If you want any…
Q: 8. Kleck and Kovandzic (2009) examined whether the level of homicide in a particular city affected…
A: Disclaimer: Here, we are asked to solve two parts (d and e). We are solving the mentioned parts…
Q: Scientists want to investigate a possible relationship between the number of hours of sunlight in a…
A: Given data: Hours of sunlight Level of depression (%) 8 20 4 50 10 10 6 45 7 15
Q: How do I explain if the mean and median are different, comparing the tibia length before and after…
A: Mean is the average of all the data set and it is the measure of central tendency. It is calculated…
Q: he data given to the right includes data from 36 candies, and 8 of them are red. The company mat…
A: We have given that, Favourable cases (X) = 8 and sample size (n) = 36 Then, We will find the 90%…
Q: Determine the sampling procedure to be used and explain why. Determine the population under…
A: Sampling: In any survey or a research, surveying all the units is not feasible. It may increase time…
Q: Zika is a serious and highly contagious virus. The Department of Health keeps records of all…
A: given data test positive test negative total haszika 8.2% 0.7% 8.9% does not have zika 2.3%…
Q: The amount of money, in dollars, that a police department collects annually from drug asset…
A: Level of measurement: In statistics, variables in the data often classified in various categories…
Q: IF X₁, X₂₁.... X n then show that is a rs from NC₁, 6²) U = {² (x²-1) ² ~ X ²nt 2 NO.: DATE:
A:
Q: Find the largest probability that any random variable's values are smaller than its mean by 4…
A:
Q: 6.49 Let Y₁ be a binomial random variable with n, trials and probability of success given by p. Let…
A: Given Y1~Bin(n1,p) and Y2~Bin(n2,p) Y1 and Y2 are independent. Result: Y1 and Y2 are…
Q: How many more times likely are children to enjoy riding roller coasters at least once a year than…
A: Given that bar graph Roller coaster opinion of adults and children who enjoy or did not enjoy
Q: (A) Some form of evidence for normality should be provided before doing statistical analyses. (B)…
A: Most of the statistical procedures require normality as a prerequisite. Parametric statistical…
Q: Please use the accompanying Excel data set or accompanying Text file data set when completing the…
A: Given information: There are 13 observations given. n = 13 x 3.775302 3.350679 4.217981…
Q: If the probability that a randomly chosen college student is up to date on vaccines is 0.42, then…
A: The question is about probability Given : Prob. of a randomly chosen college stud. is up to date on…
Q: (a) Construct a frequency distribution with the first class having a lower class limit of 30,000 and…
A: It is given that the data represent the per capita disposable income for 25 randomly selected cities…
Q: Assume researchers are trying to find out the mean concentration levels of a specific drug in a…
A: Given that the sample size n = 40 sample mean x = 7.1 mcg/ml Sample standard deviation S = 1.7…
Q: Read and Understand Hina wants to discover whether the type of weather will affect the mood of the…
A: Given information: The data is related to the type of weather is affect the mood of the population…
Q: Beanie babies are toy stuffed animals that have become valuable collector’s items. Beanie World…
A: a) A pie chart for the retired or current status of the 50 Beanie babies is constructed using…
Q: Show that if Y₁ has a x² distribution with v₁ degrees of freedom and Y₂ has a x² distribution with…
A:
Q: Stanford-Binet IQ Test scores are normally distributed with a mean score of 100 and a standard…
A:
Q: The diameter of a particle of contamination (in micrometers) is modeled with the probability density…
A: Ans# The probability density function is f(x) = 2x3 , for x > 1 Find (d) P(X…
Q: Q1: In a factory, there are three types of machines M1, M2 and M3 which produces 25% 35% and 40% of…
A: Given Information: There are three machines M1, M2 and M3. M1 produces 25% of the total bolts. Of…
Q: 23. Table Q3 1 2 0.15 a 3 0.4 X P(X=x) Given E(X)= 3.05, calculate the values of a and b. 6 b
A: a=0.25 b=0.20
Q: Read and Understand Hina wants to discover whether the type of weather will affect the mood of the…
A: Given that, Level of significance =0.10 or 10% P value is less than 0.10 or 10%. That is p-value =…
Q: 12 11 10 9 8 7 6 5 4 3 2 1 1 0 0 0 1 0 0 2 2 3 2 2 2 For these data, calculate the variance, o².…
A:
Q: The lengths of human pregnancies can be described by a Normal model with a mean of 268 days and a…
A: Given: Length of human pregnancy is normally distributed with μ=268σ=15
Q: A statistical analysis result had a p- value of 0.00; all the following statements are correct, but…
A: The given information is, P-value = 0.00 But, here level of significance (α) is not given .…
Q: stimate of o, how many replicate determination er for the mean for the analysis of a sample to…
A: The standard deviation is 0.41 Confidence levels are 99%, 95%, 90% with margin of errors 0.3,0.3,0.2
Q: E and F are mutually exclusive events. P(E) = 0.1; P(F) = 0.6. Find P(E | F) de
A:
Q: baseball player hit 65 home runs in a season. Of the 65 home runs, 21 went to right field, 20 went…
A: A baseball player hit 65 home runs in which Right center field=20 Center field= 11 Left center…
Q: Find the range and standard deviation. The table below gives the number of hours spent watching TV…
A: Given data is10,5,1,2,7,3,4,8,7,3,3,7,5,8,3,3,1,8,10,6,5,1,9,2sample size(n)=24
Q: (a) Find the local maximum and minimum points, including y-coordinates. (b) Find absolute maximum…
A: Here we need to find local maximum, local minimum, absolute maximum and absolute minimum values from…
Q: A problem in statistics is given to three students A,B,C . Whose chances of solving it are…
A:
Q: Obs. 1 2 3 4 6 7 8 9 10 00 Xu X 5 s LD 00 6 14 55 12 15 16 16 19 Y 23 16 25 ~~ 28 13 51 37 51 51 788…
A: The following formulas are used to calculate the desired entities: β^1=Covx,yVarx; β^0=y¯-β^1x¯;…
Q: The diameter of a particle of contamination (in micrometers) is modeled with the probability density…
A: I solved first three subparts because of Bartleby policy. if you want more, please upload…
Q: The following segmented bar graph shows the percentage of basketball players and football players…
A: The given bar graph shows the percentage of basketball players and football players who participate…
Q: Use the given frequency distribution to construct a frequency histogram, a relative frequency…
A: The data shows the frequency distribution of heights.
Q: A random sample of 10 subjects have weights with a standard deviation of 11.5602 kg. What is the…
A: Here, in this question, given that a random sample of 10 subjects have weights with standard…

Step by step
Solved in 2 steps
