he data given to the right includes data from 36 candies, and 8 of them are red. The company mat makes the candy claims that 32% of its candies are red. Use the sample data to construct a 30% confidence interval estimate of the percentage of red candies. What do you conclude about the claim of 32%? Construct a 90% confidence interval estimate of the population percentage of candies that are red. %
he data given to the right includes data from 36 candies, and 8 of them are red. The company mat makes the candy claims that 32% of its candies are red. Use the sample data to construct a 30% confidence interval estimate of the percentage of red candies. What do you conclude about the claim of 32%? Construct a 90% confidence interval estimate of the population percentage of candies that are red. %

MATLAB: An Introduction with Applications
6th Edition
ISBN:9781119256830
Author:Amos Gilat
Publisher:Amos Gilat
Chapter1: Starting With Matlab
Section: Chapter Questions
Problem 1P

Related questions
Question
Transcribed Image Text:K
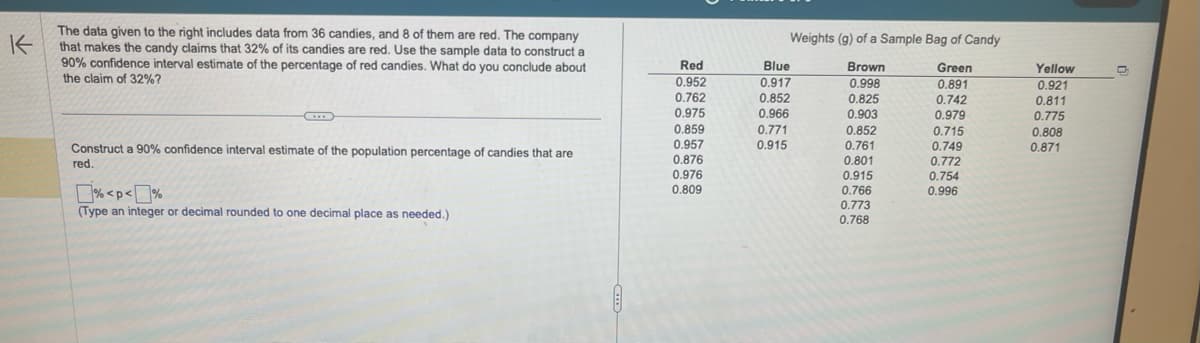
The data given to the right includes data from 36 candies, and 8 of them are red. The company
that makes the candy claims that 32% of its candies are red. Use the sample data to construct a
90% confidence interval estimate of the percentage of red candies. What do you conclude about
the claim of 32%?
Construct a 90% confidence interval estimate of the population percentage of candies that are
red.
%<p<%
(Type an integer or decimal rounded to one decimal place as needed.)
Red
0.952
0.762
0.975
0.859
0.957
0.876
0.976
0.809
Weights (g) of a Sample Bag of Candy
Brown
Green
0.998
0.891
0.825
0.742
0.903
0.979
Blue
0.917
0.852
0.966
0.771
0.915
0.852
0.761
0.801
0.915
0.766
0.773
0.768
0.715
0.749
0.772
0.754
0.996
Yellow
0.921
0.811
0.775
0.808
0.871
C
Expert Solution
This question has been solved!
Explore an expertly crafted, step-by-step solution for a thorough understanding of key concepts.

Step by step
Solved in 3 steps with 1 images

Recommended textbooks for you
MATLAB: An Introduction with Applications
Statistics
ISBN:
9781119256830
Author:
Amos Gilat
Publisher:
John Wiley & Sons Inc

Probability and Statistics for Engineering and th…
Statistics
ISBN:
9781305251809
Author:
Jay L. Devore
Publisher:
Cengage Learning

Statistics for The Behavioral Sciences (MindTap C…
Statistics
ISBN:
9781305504912
Author:
Frederick J Gravetter, Larry B. Wallnau
Publisher:
Cengage Learning
MATLAB: An Introduction with Applications
Statistics
ISBN:
9781119256830
Author:
Amos Gilat
Publisher:
John Wiley & Sons Inc
Probability and Statistics for Engineering and th…
Statistics
ISBN:
9781305251809
Author:
Jay L. Devore
Publisher:
Cengage Learning
Statistics for The Behavioral Sciences (MindTap C…
Statistics
ISBN:
9781305504912
Author:
Frederick J Gravetter, Larry B. Wallnau
Publisher:
Cengage Learning

Elementary Statistics: Picturing the World (7th E…
Statistics
ISBN:
9780134683416
Author:
Ron Larson, Betsy Farber
Publisher:
PEARSON

The Basic Practice of Statistics
Statistics
ISBN:
9781319042578
Author:
David S. Moore, William I. Notz, Michael A. Fligner
Publisher:
W. H. Freeman

Introduction to the Practice of Statistics
Statistics
ISBN:
9781319013387
Author:
David S. Moore, George P. McCabe, Bruce A. Craig
Publisher:
W. H. Freeman