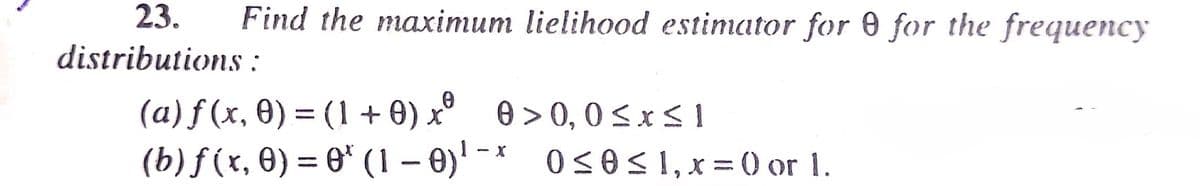
23. Find the maximum lielihood estimator for 0 for the frequency distributions : (a) f (x, 0) = (1 + 0) x° 0>0, 0SxSI (b) f(r, 0) = 6* (1 – 0)' -* 050S1, x= (0 or L.


Q: Question 4 4 pts Conduct a full hypothesis testing on the following problem and then choose among…
A: From the given data we calculate mean and sample standard deviation. Sample mean = 106.363 Sample…
Q: If 471 households were surveyed out of which 385 households have internet fiber cable, what is the…
A: Among 471 households 385 households have internet fiber cable, therefore 471-385 = 86 households…
Q: Please help me answer questions from pictures with the following information below: A random sample…
A: Given data: Sample 1: 99 91 119 130 93 123 112 93 125 95 125 117 97 122 127 88 Sample 2: 94 109 99…
Q: 4. (a) Explain in words the meaning of P(A|B) State the relationship between A and B when: (i)…
A:
Q: A random sample of size 30 from a normal population yields x̅ = 69 and s = 4. The lower bound of a…
A:
Q: Recall that the researchers reported the mean and the standard deviation of the anxiety scale for…
A: The question is about central limit theorem Given : The popl mean ( μ ) = 14.2 The popl. std…
Q: A statistics instructor believes that fewer than 20% of Evergreen Valley College (EVC) students…
A: Given that A statistics instructor believes that fewer than 20% of Evergreen Valley College (EVC)…
Q: ep 1 of 3: Find the second quartile.
A: From the given stem and leaf plot The second quartile is Q2=(2*(n+1)4)th value of the observation…
Q: Problem Four: In a dental clinic with one dentist, the average number of patients from time to time…
A: Given Total number of patients per day =2
Q: LOnduet a fun hypothesis testing on the following problem and then choose among the options what…
A: Given, Population mean, μ = 750000 Sample size, n = 35 Sample mean, X= 680000 Sample standard…
Q: What is the order of the graph? B E Figure 1 O C)6 O B) 5 O A) 4 O D) 7
A: Given problem Given that What is the order of the graph ? Ans) C) 6
Q: Do these data show sufficient evidence to reject the claim that the choice of college major is…
A: here given , contingency table of choice of college major and hand posture here use chi -square…
Q: spectively. A characteristic description of the accounting firms in the Southeast and Gulf Coast…
A: Given :
Q: The statistical rule underlying in the assumptions of the normal distribution method. A. Chebyshev’s…
A: We have given the following statement
Q: Akswer as required. A random sample of 16 light bulbs of one brand was selected to estimate the mean…
A:
Q: 4. Given $1,000.00, the following spot exchange rates, and assuming zero transaction costs, explain…
A:
Q: entry the null and alternative hypotheses. Choose the correct answer below. . Ho: o= 10 beats per…
A:
Q: Problem Situation: The prices of 400 t-shirts range from Php 50 to Php 350. Construct a table with…
A:
Q: 2. Find the range and sample variance of the following numbers: 12 13 45 16 12 12 10 10 13 15 3.…
A: The question is about descriptive statistics
Q: 5.Determine the certainty factor of the conclusion using the following MYCIN rule? IF 1) The stain…
A: The certainty factor (CF), with the condition that IF "E" THEN "H" is given as: CFH, e=CFE, e×CFH, E…
Q: The average square footage of a U.S. single family home is 2750 square feet with a standard…
A: a) Consider that a random variable X has expected value μ and standard deviation, σ. Now, according…
Q: 11 In Figure 1.6, OP is a radius of a circle with centre O and radius r. A point Q is chosen on OP…
A: Given that, OP is a radius of a circle with centre 0 and radius r. A point Q is chosen on OP in such…
Q: In 1955, Life Magazine reported that the 25-year-old mother of three worked, on average, an 80 hour…
A: Claim : the mean work week has increased for women
Q: 13.What does "zero probability of an event" means? a. The occurrence of the event is lowly…
A: Solution-: What does "zero probability of an event" means? (1) The occurrence of the event is lowly…
Q: Before microwave ovens are sold, the manufacturer must check to ensure that the radiation coming…
A: Solution-: We have following data: 15,5,5,9,9,8,3,8,18,10,5,18,10,7,15,1,5,2,10,2,12,1,15,11,8 We…
Q: What do you think would be the greatest description of a best sample? Why? (Related to random…
A: Random Sampling: In this type of sampling, every unit has an equal probability of getting selected…
Q: Let X be the number of anomalies that occur in the material of a particular region of an aircraft…
A: Solution: Let X represent the number of anomalies that occur in the material of a particular region…
Q: Direction: Compute and Illustrate the distribution of the mean. 1. The average price of a computer…
A: Given,sample size(n)=27mean(μ)=789standard deviation(σ)=348
Q: 3. Let X1, X2, X3 be a random sample drawn from an exponentially distributed popu- lation with…
A: Solution
Q: art of blood pressure (in millimetres of m
A: class interval frequency 90-105 24 105-120 62 120-135 72 135-150 26 150-165 12…
Q: 19. Schools are ranked on their retention rate, the percent of students that come back from one year…
A: Statisticians or social scientists often misrepresent data.
Q: Direction: Compute and Illustrate the distribution of the mean. 2. The number of hours spent playing…
A: Given,sample size(n)=42mean(μ)=10standard deviation(σ)=13
Q: (a) What is the level of significance? State the null and alternate hypotheses. Ho: My Hz (b) What…
A: For the given data Perform z test two population means
Q: The national housing authority (NHA) wants to investigate the relationship between the size of…
A: From the above data size of Hours is independent variable X Monthly rent is dependent variable Y…
Q: The famous iris dataset (the first sheet of the spreadsheet linked above) was first published in…
A: Statisticians use simple or multiple regression equation to predict the value of the response…
Q: Two competing brands, Rain and Shine, produced two different latex paints, and plan to sponsor a…
A: For the Rain specimens Rain (x1) x12 3.5 12.25 2.7 7.29 3.9 15.21 4.2 17.64 3.6 12.96…
Q: 178 5488 (a) Determine the linear regression model that will best predict the EPA fuel efficiency…
A:
Q: Table 1 22 33 37 53 57 69 85 102 106 112 23 33 38 53 59 70 86 104 107 112 24 35 41 54 61 70 101 105…
A: Descriptive statistics is used to describe or summarize the characteristics of the data.
Q: ______ are defined as the means in a table that represent a main effect. Group of answer choices…
A: ____Marginal means__ are defined as the means in a table that represent the main effect.
Q: 11
A: 11. Let 'X1' be the random variable represents the drying time (in hour) for paint brand 'Rain'…
Q: 157 166 162 177 155 172 163 180 160| 178 Height (in centimeters) Weight (in 158 159 166 178 | 180…
A: Given the data Height (X) Weight (Y) 157 158 166 159 162 166 177 178 155 180 172 178…
Q: 6.9 (a) Obtain a test for Ho: Bo= a versus H1 : Bo + a. (b) Obtain a confidence interval for Bo.
A:
Q: Determine the standard error for this sample. Q.6.1.2 What is the probability that the mean…
A:
Q: Q2. Observation from two random and independent samples, drawn from population 1 and 2, are given…
A: Note : As per the guidelines we are supposed to solve only one question at a time. Please repost the…
Q: Consider the scenario where we randomly select 10 bags of water-softener salt, assuming the…
A: It is given that: μ0 (claimed weight)=18σ (SD of weight at population level)=0.68n (sample size)=10
Q: "The central 50% of employees work between 12.5 hours of overtime." C. and
A: Using the given data Find ( c ) The central 50% of employees work between ? and ? hours of…
Q: In the recent Census, three percent of the U.S. population reported being of two or more races.…
A:
Q: Prove that for the hinomial population with density function f (x, p) ="C, p`q" ¯ ', x = 1 , 2,...n.…
A:
Q: cturer of matches claims that boxes contain, on average, 49 matches. ra substantial period, the…
A: *Answer:
Q: "pts.) What is the expected value of the number of free-throws that Sam will score before her first…
A: Given: Let x be the no of free throw that sam score before her first miss with probability…

Step by step
Solved in 2 steps with 2 images

- In an effort to make the distribution of income more nearly equal, the government of a country passes a tax law that changes the Lorenz curve from y = 0.98x2.1for one year to y = 0.32x2 + 0.68x for the next year. Find the Gini coefficient of income for both years. (Round your answers to three decimal places.) after before13. Find the minimum and maximum value of the function on the giveninterval.y = 2x 2 + 4x + 5 [-2, 2]