Please help me answer questions from pictures with the following information below: A random sample of n1 = 16 communities in western Kansas gave the following information for people under 25 years of age. x1: Rate of hay fever per 1000 population for people under 25 99 91 119 130 93 123 112 93 125 95 125 117 97 122 127 88 A random sample of n2 = 14 regions in western Kansas gave the following information for people over 50 years old. x2: Rate of hay fever per 1000 population for people over 50 94 109 99 95 110 88 110 79 115 100 89 114 85 96
Please help me answer questions from pictures with the following information below: A random sample of n1 = 16 communities in western Kansas gave the following information for people under 25 years of age. x1: Rate of hay fever per 1000 population for people under 25 99 91 119 130 93 123 112 93 125 95 125 117 97 122 127 88 A random sample of n2 = 14 regions in western Kansas gave the following information for people over 50 years old. x2: Rate of hay fever per 1000 population for people over 50 94 109 99 95 110 88 110 79 115 100 89 114 85 96

MATLAB: An Introduction with Applications
6th Edition
ISBN:9781119256830
Author:Amos Gilat
Publisher:Amos Gilat
Chapter1: Starting With Matlab
Section: Chapter Questions
Problem 1P

Related questions
Question
Please help me answer questions from pictures with the following information below:
A random sample of n1 = 16 communities in western Kansas gave the following information for people under 25 years of age.
x1: Rate of hay fever per 1000 population for people under 25
99 91 119 130 93 123 112 93
125 95 125 117 97 122 127 88
A random sample of n2 = 14 regions in western Kansas gave the following information for people over 50 years old.
x2: Rate of hay fever per 1000 population for people over 50
94 109 99 95 110 88 110
79 115 100 89 114 85 96
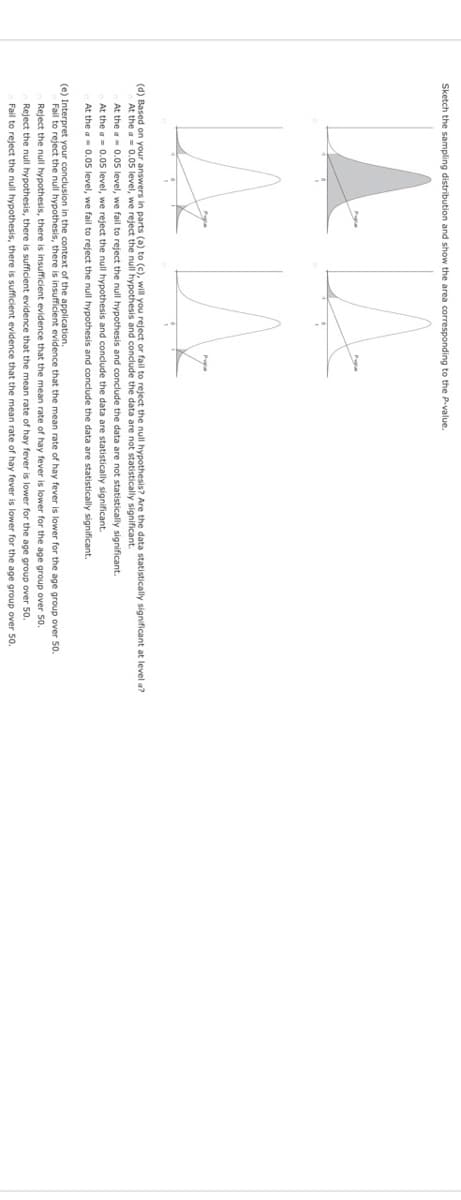
Transcribed Image Text:Sketch the sampling distribution and show the area corresponding to the P-value.
(d) Based on your answers in parts (a) to (c), will you reject or fail to reject the null hypothesis? Are the data statistically significant at level a?
At the a = 0.05 level, we reject the null hypothesis and conclude the data are not statistically significant.
At the a- 0.05 level, we fail to reject the null hypothesis and conclude the data are not statistically significant.
At the a = 0.05 level, we reject the null hypothesis and conclude the data are statistically significant.
At the a- 0.05 level, we fail to reject the null hypothesis and conclude the data are statistically significant.
(e) Interpret your conclusion in the context of the application.
Fail to reject the null hypothesis, there is insufficient evidence that the mean rate of hay fever is lower for the age group over 50.
Reject the null hypothesis, there is insufficient evidence that the mean rate of hay fever is lower for the age group over 50.
Reject the null hypothesis, there is sufficient evidence that the mean rate of hay fever is lower for the age group over 50.
Fail to reject the null hypothesis, there is sufficient evidence that the mean rate of hay fever is lower for the age group over 50.
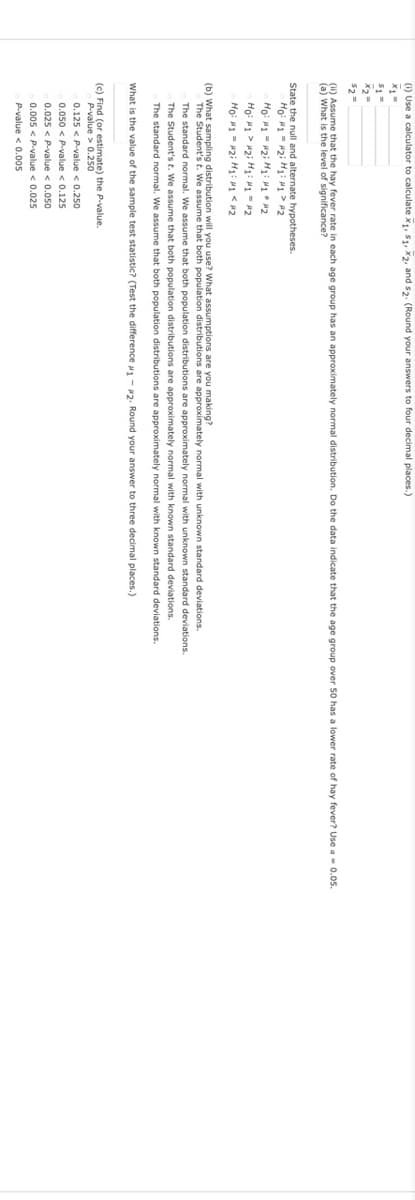
Transcribed Image Text:(1) Use a calculator to calculate x1, S1, X2, and s2. (Round your answers to four decimal places.)
(1) Assume that the hay fever rate in each age group has an approximately normal distribution. Do the data indicate that the age group over 50 has a lower rate of hay fever? Use a- 0.0s.
(a) What is the level of significance?
State the null and alternate hypotheses.
Ho: H1 = #2i H1: 1 > #2
Ho: H1 > #2i H1: M-2
Ho: H1 - 2i H1: 1 < #2
(b) What sampling distribution will you use? What assumptions are you making?
The Student's t. We assume that both population distributions are approximately normal with unknown standard deviations.
The standard normal. We assume that both population distributions are approximately normal with unknown standard deviations.
The Student's t. We assume that both population distributions are approximately normal with known standard deviations.
The standard normal. We assume that both population distributions are approximately normal with known standard deviations.
What is the value of the sample test statistic? (Test the difference 1 - 2. Round your answer to three decimal places.)
(c) Find (or estimate) the P.value.
P-value > 0.250
0.125 < P-value < 0.250
0.050 < P-value < 0.125
0.025 < P-value < 0.050
0.005 < P-value < 0.025
P-value < 0.005
Expert Solution
This question has been solved!
Explore an expertly crafted, step-by-step solution for a thorough understanding of key concepts.

This is a popular solution!

Trending now
This is a popular solution!

Step by step
Solved in 2 steps

Recommended textbooks for you
MATLAB: An Introduction with Applications
Statistics
ISBN:
9781119256830
Author:
Amos Gilat
Publisher:
John Wiley & Sons Inc

Probability and Statistics for Engineering and th…
Statistics
ISBN:
9781305251809
Author:
Jay L. Devore
Publisher:
Cengage Learning

Statistics for The Behavioral Sciences (MindTap C…
Statistics
ISBN:
9781305504912
Author:
Frederick J Gravetter, Larry B. Wallnau
Publisher:
Cengage Learning
MATLAB: An Introduction with Applications
Statistics
ISBN:
9781119256830
Author:
Amos Gilat
Publisher:
John Wiley & Sons Inc
Probability and Statistics for Engineering and th…
Statistics
ISBN:
9781305251809
Author:
Jay L. Devore
Publisher:
Cengage Learning
Statistics for The Behavioral Sciences (MindTap C…
Statistics
ISBN:
9781305504912
Author:
Frederick J Gravetter, Larry B. Wallnau
Publisher:
Cengage Learning

Elementary Statistics: Picturing the World (7th E…
Statistics
ISBN:
9780134683416
Author:
Ron Larson, Betsy Farber
Publisher:
PEARSON

The Basic Practice of Statistics
Statistics
ISBN:
9781319042578
Author:
David S. Moore, William I. Notz, Michael A. Fligner
Publisher:
W. H. Freeman

Introduction to the Practice of Statistics
Statistics
ISBN:
9781319013387
Author:
David S. Moore, George P. McCabe, Bruce A. Craig
Publisher:
W. H. Freeman