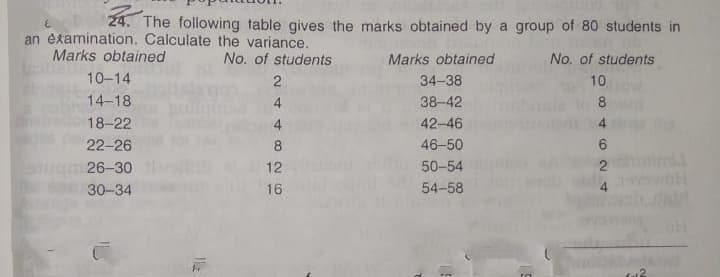
24. The following table gives the marks obtained by a group of 80 students in an ekamination. Calculate the variance. Marks obtained No. of students Marks obtained No. of students 10-14 2 34-38 10 14-18 4 38-42 8 18-22 42-46 4 22-26 8 46-50 26-30 12 50-54 30-34 16 54-58
Q: A national nursing organization is lobbying congress for sunding to hire more nurses nationwide. One…
A: Here sample size n=9
Q: students and obtained the following data: 7.9, 5.5, 7.6, 6.2, 6.5, 7.8, 7.2, 7.5, 6.5, 8.5, 6.9,…
A: The given data is 7.9 5.5 7.6 6.2 6.5 7.8 7.2 7.5 6.5 8.5 6.7 7.5 9.4 7.6 6.2 5.6 8 8.1 5.9 7.3…
Q: 20. The following table gives the marks obtained by a group of 80 Students in an examination.…
A: The frequency of a class in a grouped data represented the number of observation lies in a class.…
Q: The following are 10 employee salaries from a company of 500 employees. Calculate the variance of…
A: We need to compute the variance . These are the sample data that have been provided: Salary…
Q: Following is the data related to the daily production of the two factories of same product located…
A: Let, X:Factory 1 Y:Facrory 2 Therefore, X: 66,73,83,74,73,73,69,82,71,73,66,67,80,79,78 n1=15 Y:…
Q: You are running an Analysis of Variance to test if there is a difference in hourly rates of three…
A: Given: Total sample size N = 15 Significance level α = 0.025 Formula Used: F-statistic = MSBMSW MSB…
Q: Cigarette packets used to contain cards representing such things as flowers, film stars or football…
A:
Q: A manufacturing company produces bearings. One line of bearings is specified to be 1.64 centimeters…
A: Solution We have given the claim that The variance of the bearings be no more than 0.001 cn From…
Q: 5. Suppose that you have a sample of 500 observations on two random variables: price denoted as X,…
A: Consider, X and Y are the random variables which represent the price and profit respectively.Number…
Q: Here is a bivariate data set. y 32.2 | 32.3 16.8 51 15.5 57.6 9.5 56.2 56.9 16 22.2 | 50.8 14.2 56.3…
A: Given data, X Y X*Y X*X Y*Y 32.2 32.3 1040.06 1036.84 1043.29 16.8 51 856.8 282.24 2601…
Q: Consider the following set of numbers, each of which represents the number of hours of "cramming"…
A: It is an important part of statistics. It is widely used.
Q: The mean of prices of mobile phones is OMR 153.4 and coefficient of variation (CV.) is (8.6 %), then…
A:
Q: 1. The following data gives the number of social interactions of longer than 10 minutes in one week…
A: As per our guidelines we are supposed to answer only one question. Kindly repost other question as…
Q: Calculate the variance for the following population of N=5 scores: 4,0,7,1,3.
A: 4 1 1 0 -3 9 7 4 16 1 -2 4 3 0 0
Q: 12. The Department of Health has the following data of the number of infected persons of Covid-19 in…
A: Solution : We have given that the number of infected persons of Covid-19 in five high-risk areas in…
Q: The following bivariate data set contains an outlier. x y 58.2 2259.1 64.9 1059.8 43.1 -646.2 56.5…
A: With outlier Use the given data to form the excel table: X Y X*Y X*X Y*Y 58.2…
Q: Listed below are amounts (in millions of dollars) collected from parking meters by a security…
A:
Q: isted below are amounts (in millions of dollars) collected from parking meters by a security service…
A: The Coefficient of Variation (CV in short) is a typical measure of variation, which measures the…
Q: One sample (n1) has SS = 70 and a second sample (n2) has SS = 42. a. Find the sample variance for…
A: Given:- n1 has ss=70 , n2 has ss=42 sample varience formula = ss/(n-1)
Q: Company A and Company B are two digital film producers. A study was conducted to determine if there…
A: The appropriate null and alternative hypothesis are: The test is right-tailed and α=0.01.
Q: e contains the amount that a sample of nine customers spent for lunch ($) at a fast-food restaurant:…
A: Observation: XX X^2X2 1 4.20 17.64 2 5.03 25.3009 3 5.86 34.3396 4 6.45 41.6025 5 7.38…
Q: Suppose we have two groups of students, those who go for tutoring help and those who do not. The…
A: The appropriate test statistic is to be formulated for concluding if the math scores between both…
Q: Suppose we have two groups of students, those who go for tutoring help and those who do not. The…
A:
Q: If the following set of data is transformed by subtracting 4567 from each Tị one can the obtain the…
A: Ans => C. 2
Q: If N = 100, Compute for the mean, variance, and standard error of the following. 1. n=15, μ = 18, σ…
A: As per bartleby guideline expert have to answer first three subparts only dear student please upload…
Q: al grades for a 35-student class. Calculate the variance of the class. (Round to the hundredths) 5…
A: The mean is calculated as: Now, The mean is: x=253335=72.3714 The table that shows the accessory…
Q: 1.For a symmetric data set with a mean of 11 and a variance of 25, approximately 68% of the values…
A: Solution: Given information: μ= 11 Population mean σ2= 25 Population variance σ= σ2σ=25σ= 5…
Q: 0.02. The machine is moved to a new location. Io determine whether the variance has changed, 10 cans…
A: Here use chi square test for single sample variance test
Q: 2. Calculate Karl-person's coefficient of skewness for the following data. 25,15,23, 40, 27, 25, 23,…
A: Given: 25 15 23 40 27 25 23 25 20
Q: 4. Find the variance and standard deviation of the highest temperatures recorded in eight specific…
A: (4) The value of sample mean is,
Q: Calculate the variance for the following population of N=5 scores: 4, 0, 7, 1, 3
A: Given:N=5 , Scores : 4, 0, 7, 1, 3Calculating the mean (μ) :μ= 4+0+7+1+35= 15/5 = 3∴μ=3
Q: 15. If 4% of cellphone are found to be defective, find the mean, variance, and standard deviation of…
A: given data P(defective) = p = 0.04 sample size n = 500 x = no. of defective cellphones here x…
Q: The number of employees, wages per employee and the variance of the wages per employee for two…
A:
Q: Here are the monthly wage scales of 8 workers from XYZ Knit Works. 15 13 18 12 21 13 26 22 a.…
A: Given : Monthly wage scale of 8 workers from XYZ knit works Sample size (n) =8 X 15 13 18…
Q: 4. The given table below shows the respective correlation coefficients between two variables with…
A: Given that: ρ1=0.85 p1 = 0.03 ρ2=0.63 p2 = 0.005
Q: A biased die is thrown thirty times and the number of sixes seen is eight. If the dic is thrown a…
A: Given No of trails (n)=12 Out of 30 rolls we observe 8 sixes
Q: . If one sample has n = 5 scores with SS = 40 and a second sample has n = 5 scores with SS = 20,…
A: From the provided information,
Q: Suppose a certain retailer sells several models of refrigerators. A random sample of the models sold…
A: Hi! Thank you for the question, As per the honor code, we are allowed to answer three sub-parts at a…
Q: 1. According to a fast food manager, the average number of customers between 8am to 11am is 10, with…
A: Given, Outlet No. of customers 1 11 2 10 3 9 4 10 5 10 6 11 7 11 8 10 9 12 10…
Q: Ensure the RaceResults worksheet is active, then use the FREQUENCY function to calculate the…
A: Correlation: By correlation we mean the association or interdependence between two variables. If two…
Q: 4. According to the information given below, compute the correlation coefficient and the covariance…
A: I have answered questions step by step using excel below.
Q: Calculate the variance of each of these fictitious samples: (a) 12, 6, 7, 3 (b) 9, 13, 8, 10 (c) 21,…
A: (a) Obtain the value of variance. The value of variance is obtained below as follows: Use…
Q: If X, = 2, X, = 3, X, = 1, X, = 4, X, = 1, and X, = 8 be a random sample taken from a population…
A:
Q: 1. A researcher wishes to determine if the following distances (in meters) traveled by a random…
A: The regression line is used to predict the value based on the relationship between the independent…
Q: Find the variance of the given table in the attached photo
A:
Q: It is known that the probability of winning Galatasaray Professional Football Team in matches is…
A:
Q: Five persons, who were suffering from depression, attended 10 one-hour counseing sessions. The…
A:
Step by step
Solved in 2 steps with 1 images
- What is the explained variance and unexplained variance. correlation coefficient, is .771 Coefficient of determination is R squared. r2 = (.771)2 =.594441 or 59.44% of Y is due to the variation of x. 1-r2 = 1-.59441= .40559 or 40.55%The following table gives the marks obtained by a group of 80 students in an examination. Calculate the variance. Marks obtained No. of students Marks obtained No. of students 10-14 2 34-38 10 14-18 4 38-42 8 18-22 4 42-46 4 22-26 8 46-50 6 26-30 12 50-54 2 30-34 16 54-58 4Suppose that 90% of Narnians are children, that Narnian children have normally distributed BMIs with a mean of 25 kg/m^2 and variance of 64 (kg/m^2)^2 , and that Narnian adults have normally distributed BMIs with a mean of 30 kg/m^2 and variance of 100 (kg/m^2)^2 . WHO currently categorizes BMIs greater than 30 as obese. a. What is the prevalence of obesity among Narnian children? b. What is the prevalence of obesity among Narnian adults? c. What is the overall prevalence of obesity among Narnians? d. Are age and obesity statistically independent in Narnia? e. What proportion of Narnians are obese children? f. What proportion of obese Narnians are children?
- Compute for the variance of all the data on Table 2. Show your solution and answer inside the box. Express your final answer in scientific notation. Table 2 Student A Student B Student C 23.3124 mm 23.443 mm 22.2250 mm 23.7164 mm 23.444 mm 22.2250 mm 23.5489 mm 23.445 mm 22.2250 mm 23.8899 mm 23.446 mm 22.2250 mmA school is sending 15 children to a camp. If 30% of the children in the school are first graders, and the 15 children are selected at random from among all 6 grades at the school, find the mean and the variance of the number of first graders chosen.