4. The given table below shows the respective correlation coefficients between two variables with the corresponding p-values. Assume that the target population is composed of all ADZU employees. Required: a) Write the null hypothesis(Ho) and alternative hypothesis (Ha) for each pair of variables as reflected in the table below. b) Decide whether the null hypothesis can be rejected and then discuss the results (at least 15 words) for each pair of variables. Fasting Blood Sugar Level (FBSL) Systolic Blood Pressure(SBP) 0.85 p-value = 0.03 Body Mass Index (BMI) -0.63 p-value=0.005
4. The given table below shows the respective correlation coefficients between two variables with the corresponding p-values. Assume that the target population is composed of all ADZU employees. Required: a) Write the null hypothesis(Ho) and alternative hypothesis (Ha) for each pair of variables as reflected in the table below. b) Decide whether the null hypothesis can be rejected and then discuss the results (at least 15 words) for each pair of variables. Fasting Blood Sugar Level (FBSL) Systolic Blood Pressure(SBP) 0.85 p-value = 0.03 Body Mass Index (BMI) -0.63 p-value=0.005

Holt Mcdougal Larson Pre-algebra: Student Edition 2012
1st Edition
ISBN:9780547587776
Author:HOLT MCDOUGAL
Publisher:HOLT MCDOUGAL
Chapter11: Data Analysis And Probability
Section: Chapter Questions
Problem 8CR

Related questions
Question
Transcribed Image Text:ont
Paragraph
Styles
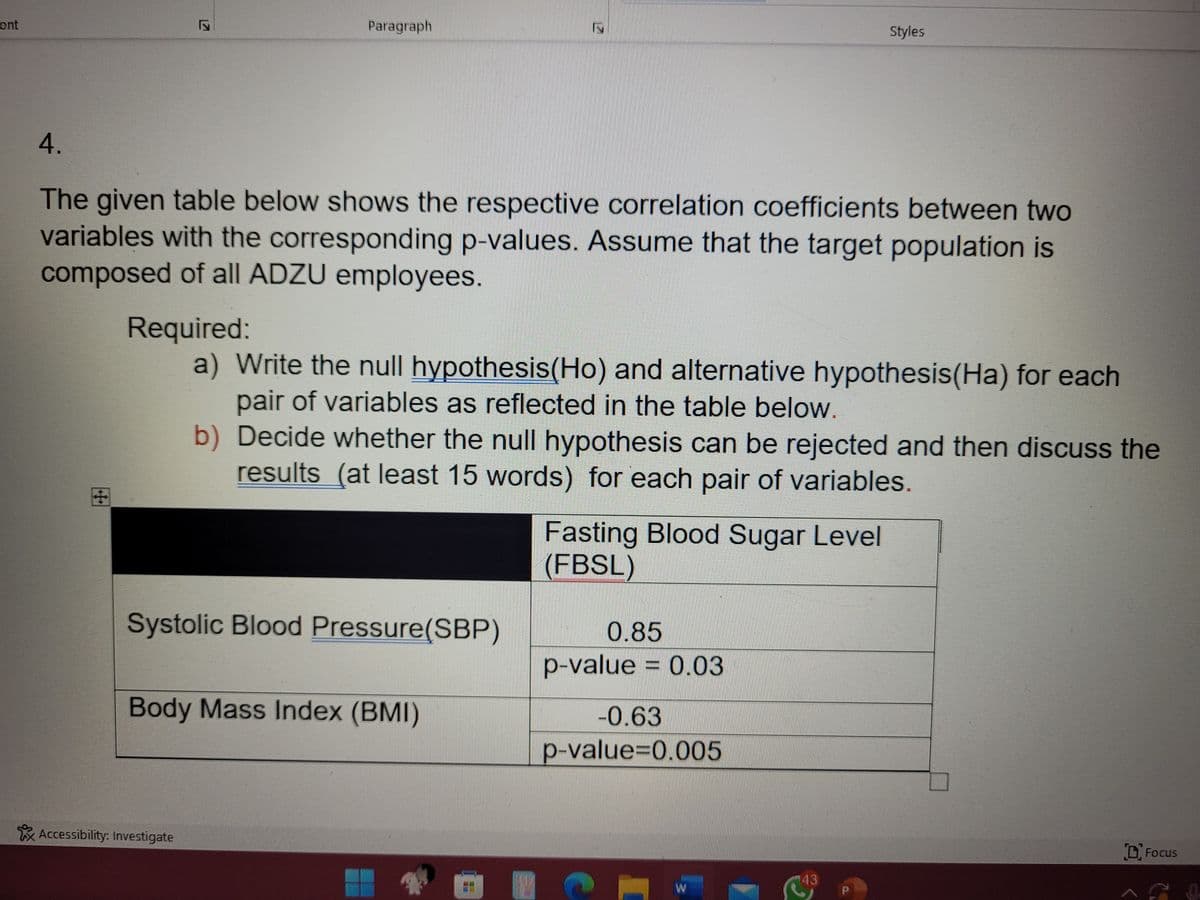
4.
The given table below shows the respective correlation coefficients between two
variables with the corresponding p-values. Assume that the target population is
composed of all ADZU employees.
Required:
a) Write the null hypothesis(Ho) and alternative hypothesis (Ha) for each
pair of variables as reflected in the table below.
b) Decide whether the null hypothesis can be rejected and then discuss the
results (at least 15 words) for each pair of variables.
Fasting Blood Sugar Level
(FBSL)
Systolic Blood Pressure (SBP)
0.85
p-value = 0.03
Body Mass Index (BMI)
-0.63
p-value=0.005
Focus
W
Accessibility: Investigate
17
17
43
Expert Solution
This question has been solved!
Explore an expertly crafted, step-by-step solution for a thorough understanding of key concepts.

Step by step
Solved in 3 steps

Recommended textbooks for you
Holt Mcdougal Larson Pre-algebra: Student Edition…
Algebra
ISBN:
9780547587776
Author:
HOLT MCDOUGAL
Publisher:
HOLT MCDOUGAL
Holt Mcdougal Larson Pre-algebra: Student Edition…
Algebra
ISBN:
9780547587776
Author:
HOLT MCDOUGAL
Publisher:
HOLT MCDOUGAL