Compute the standard deviation for the following sample data. Provide answer up to 3 decima its 32,41,63,24,29,30, 40,22,25,37 Hint:
Compute the standard deviation for the following sample data. Provide answer up to 3 decima its 32,41,63,24,29,30, 40,22,25,37 Hint:

Glencoe Algebra 1, Student Edition, 9780079039897, 0079039898, 2018
18th Edition
ISBN:9780079039897
Author:Carter
Publisher:Carter
Chapter10: Statistics
Section10.5: Comparing Sets Of Data
Problem 14PPS

Related questions
Question
plz solve it within 30-40 mins I'll give you multiple upvote
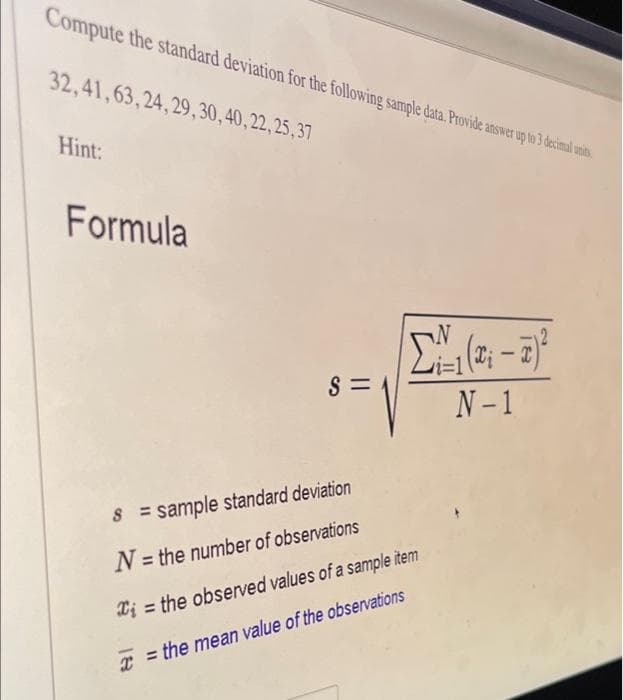
Transcribed Image Text:Compute the standard deviation for the following sample data. Provide answer up to 3 decimal unis,
32,41,63,24,29,30, 40,22,25,37
Hint:
Formula
-
S =
N- 1
= sample standard deviation
N = the number of observations
Xi = the observed values of a sample item
x = the mean value of the observations
Expert Solution
This question has been solved!
Explore an expertly crafted, step-by-step solution for a thorough understanding of key concepts.

This is a popular solution!

Trending now
This is a popular solution!

Step by step
Solved in 2 steps

Recommended textbooks for you
Glencoe Algebra 1, Student Edition, 9780079039897…
Algebra
ISBN:
9780079039897
Author:
Carter
Publisher:
McGraw Hill
Glencoe Algebra 1, Student Edition, 9780079039897…
Algebra
ISBN:
9780079039897
Author:
Carter
Publisher:
McGraw Hill