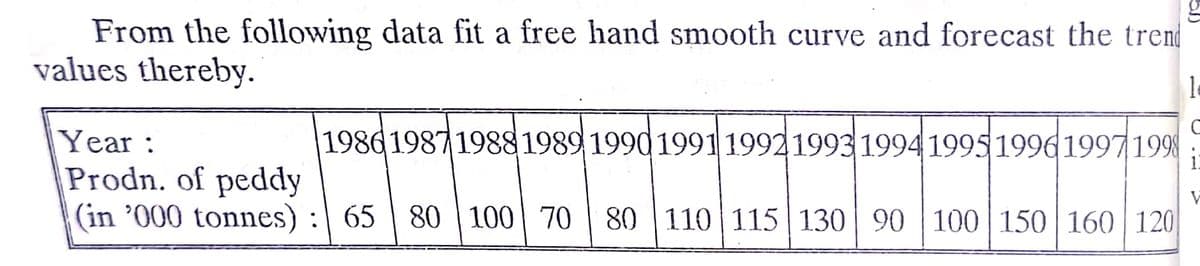
From the following data fit a free hand smooth curve and forecast the trend values thereby. |1986198719881989 199019911992199319941995199619971998 Year: Prodn. of peddy (in '000 tonnes) : 65 | 80 | 100| 70 | 80 110 115 130 90 100 150 160 120


Q: Select the statistical values needed to create box and whisker plot. O maximum O upper quartile…
A: We use five number summary of the data to create a box and whisker plot.
Q: A randomly sampled group of patients at a major U.S. regional hospital became part of a nutrition…
A: We have given thatMean(µ) = 2.9Sample size (n) = 15Sample mean (x̅) = 3.5Standard deviations (s) =…
Q: A student was interested in the cigarette-smoking habits of college students and collected data from…
A: Given that Males who smoke=20 Males who does not smoke=30 Females who smoke=25 Females who does not…
Q: Construct a 956 two-sided confidence interval on mean compressive strength. Th
A: Here population standard deviation known so use z critical for confidence interval
Q: MO22. A hypothesis will be used to test that a population mean equals 10 against the alternative…
A: Given that Test is that whether the population mean is less than 10.
Q: The average depth of the Hudson Bay is 305 feet. Climatologists were interested in seeing if the…
A: GivenMean(x)=306.2Population variance(σ2)=3.57sample size(n)=55α=0.05standard…
Q: Group 1 Group 2 Group 3 4.2 4.5 1.2 4.8 2.4 -0.3 3.4 2.3 0.9 2.5 Problem #2: Using the data from…
A: I solved this Question in excel, same is for your reference:
Q: A local board of education conducted a survey of residents in the community concerning a property…
A: We have given that, Favorable cases (X) = 410 and sample size (n) = 850 Then, We will find 95%…
Q: a) Find all m 2 1 such that 27 = 9 (mod m). [1 b) If A = |0 1 1| is a zero-one matrix, find A ^ A2].…
A:
Q: 5. The position x of an object as a function of time t. Time, t (s) Distance, x (m) 5.0 -225 1.0 2.0…
A: Given that, The position x of an object as a function of time t. The table is given below for time…
Q: Questions 1 and 2: Set up the Null and Alternative hypotheses to test the following claims: 1. A…
A: see the attachment please.....
Q: company finds that for its 12 ounce cans of soda, the actual amount of soda inside is Normally…
A: Mean(µ) = 12Standard deviations (σ) = 0.25X ~ N (µ, σ )= N (12,0.25)
Q: A company finds that for its 12 ounce cans of soda, the actual amount of soda inside is Normally…
A: Solution-: Given: μ=12,σ=0.25 We find x value such that P[X<x]=0.15
Q: Cnd the random variable ) has Kinan (n-1) what is the Var Câ)
A: Given X=λ ∑i=1n1Xi-1X¯~χn-12
Q: . P(z ≥ -.98) 2. P(z ≤ 1.84) 3. P(z ≥ 2.15)
A: Let Z be the random variable from normal distribution then we will find the following probabilities,…
Q: MO22. A hypothesis will be used to test that a population mean equals 10 against the alternative…
A:
Q: A 99% confidence interval for the difference in the proportion of registered voters that support…
A:
Q: 1. The Human Toxome Project (HTP) is working to understand the scope of industrial pollution in the…
A: Given data
Q: An article reports an investigation into the toxicity of bilirubin on several cell lines. Ten sets…
A: From the provided information,
Q: Mean = Variance Standard Deviation 10.55 280.95 16.77 2. What is the data value (raw score)…
A: Let X be the random variable from normal distribution with mean (μ) = 10.55 and standard deviation…
Q: winning $12, a 20% chance of breaking even (not winning or losing any money), and 60% chance of…
A:
Q: Choose the most appropriate completion of the sentence. In order to indicate a strong correlation…
A: In order to indicate a strong correlation coefficient between two variables then the correlation…
Q: During a period of 11 years 1689 of the people selected for grand jury duty were sampled, and 27% of…
A:
Q: In Exercise 5.13, the joint density function of Y1 and Y, is given by 30yı y, yı – 1 0IY, = 75).
A:
Q: To determine this, you test the following hypotheses: Select one: H0:p1=p2 vs Ha:p1p2 H0:p1=p2…
A: From the given data Option (4) is correct to test the hypothesis ie, Null hypothesis:H0:p1=p2…
Q: MO22. A hypothesis will be used to test that a population mean equals 10 against the alternative…
A: Given that μ=10 Null hypothesis=H0 , Alternate hypothesis=H1 H0: μ=10 Vs H1: μ<10
Q: What is the mean of the x sampling distribu- tion? b. What is the standard deviation of the x…
A: In the library on a university campus, there is a sign in the elevator that indicates a limit of 16…
Q: Find the probability that the financial adviser is sacked. ii. If you are told that the adviser was…
A: HERE GIVEN, A stockbroker is having a bad year. He is wondering whether to sack his financial…
Q: According to the National Institute on Alcohol Abuse and Alcoholism, and the National Institutes of…
A: From the provided information, Sample size (n) = 462 From which 166 admitted to having engaged in…
Q: Vehide ranh pate in Europe an countries have feen se cardid as thoun in table 4. Jable 3 is there…
A: According to the given information, it has been instructed to use the number 16 in Table 2 which…
Q: Learner Height (in meter) Consider the heights of 5 learners. Suppose you are interested in…
A: Since you have posted a question with multiple subparts, we will solve first 3 sub-parts for you…
Q: Assume you have a hypothesis test for mean: Ho : µ =25.07 Hị : µ >25.07 You have a sample with a…
A: Given that Hypothesized Population Mean (\mu)(μ) = 25.0725.07 Sample Standard Deviation (s)(s)…
Q: Please draw a scatterplot that would describe a positive association and then a separate one that…
A: We have to draw a scatterplot that would describe a positive association and then a separate one…
Q: 1. Use Simple Random Sampling to generate a sample of sixteen (16) students from your class and…
A: Disclaimer : “Since you have posted a question with multiple sub-parts, we will solve first three…
Q: The hypotheses to be tested are : H0:pE= vs Ha:pE<pH, where pE is the proportion of engineering…
A: It is given that For engineering major, sample size n1 = 40, X1 = 20 For humanities major, sample…
Q: Which of the following is correct about Factorial Designs? A. If there are no main effects, there…
A: Given that - Which of the following is correct about Factorial Designs? A. If there are no main…
Q: There are three machines, two working and one that is used as a spare. A working machine will…
A: Given that - There are three machines, two working and one that is used as a spare. A working…
Q: The equation for the 1.5 mile run/jog test is: VO2max (ml/kg/min) = 3.5 + [483 + (time in min.)] %3D…
A:
Q: Suppose babies born after a gestation period of 32 to 35 weeks have a mean weight of 2900 grams and…
A: The mean and standard deviation for 32 to 35 weeks of gestation period are 2900 and 900,…
Q: shown below: Source DF MS F Treatment 4 1041.6 Error 24 556.8 Total Calculate the Mean Square (due…
A: The Mean Square due to treatment is SSDF for the treatment.
Q: Mean = Variance Standard Deviation 48.775 726.24 26.95 8. What is the data value (raw score)…
A: Let X be the random variable from normal distribution with mean (μ) = 48.775 and standard deviation…
Q: Statistics students in Oxnard College sampled 11 textbooks in the Condor bookstore and recorded the…
A: From the provided information, Number of pages (x) Cost (y) 625 47.75 611 47.77…
Q: Create an Central Limit Theorem Daily Life Own Word Problem and Cite the importance of using it.
A:
Q: A par sample of six packages resulted in the following data: 12.8, 14.3, 11.1, 16, 13.5, 12.…
A: Given that Sample size n =6 99% confidence interval.
Q: You are given the following for cohort of VA GLWB contracts aged 65: • Beginning of year contracts…
A: Given Beginning of year contracts in force : 1500 Deaths…
Q: An urn has 5 red balls, 5 blue balls, 4 green balls, and 3 yellow balls. What is probability of…
A: It is given that Number of red balls = 5 Number of blue balls = 5 Number of green balls = 4 Number…
Q: 1. A student needs a random sample taken using Simple Random Sampling for his research study. As he…
A: Statistics is broadly classified in two ways. They are descriptive and inferential statistics.…
Q: c. Consider the following change in the time series model: Yt = P1Yt-1+ Ut Where ut follows a white…
A: This is the answer of question C.
Q: MO22. Supercavitation is a propulsion technology for undersea vehicles that can greatly increase…
A: Given,sample size(n)=8sample mean(x¯)=102.2standard deviation(σ)=4H0:μ=100H1:μ<100α=0.05
Q: Variance Standard Deviation 7 05 Mean = 3.75 49.75 14. What are the data values (raw scores)…
A: Let X be the random variable from normal distribution with mean (μ) = 3.75 and standard deviation…
Statistica forecasting

Step by step
Solved in 3 steps with 3 images

- Table 6 shows the population, in thousands, of harbor seals in the Wadden Sea over the years 1997 to 2012. a. Let x represent time in years starting with x=0 for the year 1997. Let y represent the number of seals in thousands. Use logistic regression to fit a model to these data. b. Use the model to predict the seal population for the year 2020. c. To the nearest whole number, what is the limiting value of this model?The MAD for the forecast developed using a weighted 2-year moving average with weights of 0.350.35 and 0.650.65 is what?The table given below indicates Small Holding Ltd.’s quarterly profits in 2019 and 2020.Time Period Profit (Thousands Of Rands)2019 Q1 2502019 Q2 2102019 Q3 1652019 Q4 1952020 Q1 2652020 Q2 2182020 Q3 1782020 Q4 204Q.6.3.1 Determine the trend regression function for this data set. In order to obtain full marks for this question, you must complete the relevanttable (template provided below) and then apply the appropriate timeseries formulae in the formulae sheet.Q.6.3.2 Given that the typical seasonal index for Q3 is 87.3, use this informationand the trend regression function obtained in Q.6.3.1 to determine theseasonally adjusted trend estimate for profits in Q3 of 2022.
- The table given below indicates New Holding Ltd.’s quarterly profits in 2019 and 2020.Time Period Profit (Thousands Of Rands)2019 Q1 2502019 Q2 2102019 Q3 1652019 Q4 1952020 Q1 2652020 Q2 2182020 Q3 1782020 Q4 204 Determine the trend regression function for this data set. Given that the typical seasonal index for Q3 is 87.3, use this informationand the trend regression function obtained to determine theseasonally adjusted trend estimate for profits in Q3 of 2022.Which of the following is true regarding a volcano plot? Its visualization can only display the significantly up-regulated genes and is unable to indicate significantly down-regulated genes. The p-value threshold for determining significantly up-regulated genes need not be the same as the threshold that determines significantly down-regulated genes. Points with non-significant changes aren't displayed. The x-axis displays log10-fold changes in gene expression.Find the forecast for the month of May using the exponential smoothing methodDemand dataJan 32.1 Feb 36.2 Mar 28.0 Apr 27.5And the January Forecast was: 27Smoothing constant = 0.15b) Find the mean absolute deviation (MAD) if the actual demand for May is 30.0
- For a period of 11 years, the figures in the accompanying table were found for annual change in unemployment rate and annual change in mean employee absence rate due to own illness. Year Change in UnemploymentRate Change in Mean Employee Absence Rate Due to Own Illness (Y) 1 -0.2 0.2 2 -0.1 0.2 3 1.4 0.2 4 1.0 -0.4 5 -0.3 -0.1 6 -0.7 0.2 7 0.7 -0.1 8 2.9 -0.8 9 -0.8 0.2 10 -0.7 0.2 11 -1.0 0.2 a. Estimate the linear regression of change in mean employee absence rate due to own illness on change in unemployment rate. b. Interpret the estimated slope of the regression line. thanks.The following ratio-to-moving averages for the seasonally adjusted series were found by the decomposition method applied on a time series representing quarterly sales for January 2018 to December 2020 period: a. Calculate the Seasonal Index for every quarter. b. If the trend is described by the trend line T^ = 1,000 + 30 t, what is the forecast for the fourth quarter of 2021?1. The following data has been collected to determine if a relationship exists between the amountof snowfall in Toronto and the number of students who attend lecture at U of T.Year Snowfall, x (cm) Number of students in class, y1995 173 1821996 165 1901997 152 2071998 184 1801999 178 184a. Determine the line of best fit by creating a scatter plot in Excel, a trendline, and thecorrelation coefficient. Make sure your scatter plot is properly titled and formatted.b. Explain what this correlation tells you about the relationship between the amount ofsnowfall and the number of students who attend lecture.c. How many students could we expect to attend a lecture if it were to snow 160 cm in aseason. Is this an example of interpolation or extrapolation?
- John Kittle, an independent insurance agent, uses a five-year moving average to forecast the number of claims made in a single year for one of the large insurance companies he sells for. He has just discovered that a clerk in his employ incorrectly entered the number of claims made four years ago as 1,400 when it should have been 1,200.a. What adjustment should Mr. Kittle make in next year’s forecast to take into account the corrected value of the number of claims four years ago?b. Suppose that Mr. Kittle used simple exponential smoothing with a = .2instead of moving averages to determine his forecast. What adjustment is now required in next year’s forecast? (Note that you do not need to know the value of the forecast for next year in order to solve this problem.)Q3 The following data relates to the gross value of output of a factory over the last few years:Year 2014 2015 2016 2017 2018 2019 2020Production(in ‘000 tons)60 72.5 85.6 106.8 125.5 145.4 156.2Fit a straight-line trend using the method of least squares. Calculate the parabolic trend equation to predict the average annual output. Predict the trend values using each of the model and comment on its suitabilityConsider the following data:Monthly Profit of an Auto Repair Shop Month Jan-14 Feb-14 Mar-14 Apr-14 May-14 Jun-14 Jul-14 Aug-14 Sep-14 Profit ($) 17,527 17,677 16,455 18,642 20,163 17,350 19,127 18,622 20,422 Step 3 of 4 : Determine the exponential smoothing forecast for the next time period using a smoothing constant of 0.35. If necessary, round your answer to one decimal place. I have been stuck on this for 2 days now. I do not understand exponential smoothing forecast at all and the textbook is not helpful. I have tried looking at the textbook, using the step-by-step learning tools, and youtube videos and it still isn't helping.