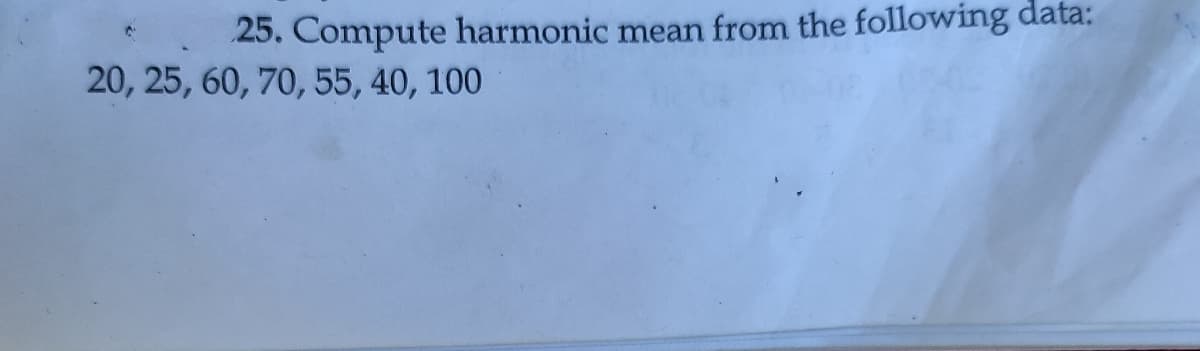
25. Compute harmonic mean from the following data: 20, 25, 60, 70, 55, 40, 100


Q: The trimmed mean is
A: From the data, the smallest observed value is 0.77, and largest observed value is 0.97. By removing…
Q: Find the range and standard deviation of the set of data. 260, 263, 266, 269, 272, 275, 278 O
A:
Q: Calculate the mean and median of the following data: 57, 19, 50, 52, 29, 53, 22, 4357, 19, 50, 52,…
A:
Q: Consider the following data set: 9, 8, 6, 11, 5, 9, 7, 6, 3, 10, 11, 9, 9, 6, 10, 7, 8, 9, 5, 9…
A: From the provided information, Number of observations (n) = 20 Arranging the data set into ascending…
Q: Suppose the following data show the introductory interest rates on a sample of 5 credit cards: 5.2,…
A: To calculate the mean interest rate of the below sample of interest rates. 5.2, 1.1, 2.6, 4.2, 3.4
Q: Find the geometric and harmonic mean of the data 256,46,45,554,356,37,895,38,753,965,35,854, 567
A: Geometric Mean : The geometric mean is a measure of central tendency, but it is a type of a less…
Q: 6. After calculating the relative frequencies for a frequency distribution, what should the sum of…
A: Since you have posted multiple questions, as per our guidelines we have provided answer for first…
Q: Consider a sample with data values of 27, 25, 21, 15, 31, 33, 28, and 25. Compute the 20th, 25th,…
A:
Q: 4. Determine the MEAN, MEDIAN, MODE, and MIDRANGE of the set of data below. Round answers to the…
A:
Q: 14. Calculate S.D. from the following data. Values : 110, 115, 120, 125, 130, 135, 140, 145, 150,…
A:
Q: Determine the mean of the following ungrouped data: 200, 175, 125, 142, 150, 125, 162, 142, 175,…
A: Given data is 200, 175, 125, 142, 150, 125, 162, 142,175, 138, 209, 168, 194, 170, 158.sample…
Q: for the following data approximate the mean number of unused vacation days at the end of the year?…
A: Days midpoint( xi) frequency(fi) xifi 1-3 2 28 56 4-6 5 27 135 7-9 8 1 8 10-12 11 5 55…
Q: 0. 1. Calculate mean from the raw-data collected by Mr. X, of 10 students and the following height…
A:
Q: The following data set represents the number of new computer accounts registered during ten…
A: Calculate Mean, Median, Mode from the following data43,37,50,51,58,105,52,45,45,10
Q: The following sample data are from a normal population: 10, 8, 12, 14, 13, 11, 7, 5. a. What is the…
A: Given data is10,8,12,14,13,11,7,5sample size(n)=8
Q: The sample mean is the point estimator of 18
A:
Q: Find the mean (average) for the following set of numbers: x=11,5,13,2,7,5,7,16,14,6
A: We have given that the set of numbers : x = 11, 5, 13, 2, 7, 5, 7, 16, 14, 6 Mean ( Average ): It…
Q: A study showed that the cost of buying a basket of 40 slipper items was 6500 in Laguna, 4,300 in…
A: Given: Cost of buying a basket of 40 slipper item in Laguna =6500 Bataan=4300 Mandaluyong=5700…
Q: Calculate the mean for the grouped data.
A:
Q: The following items represent the number of birds observed at a given feeder over the past several…
A: Given data, 34, 25, 29, 35, 22, 74, 23, 73 The objective is to find the mean number of birds to…
Q: The following values represent the distance (in miles) that a sample of 10 dating couples live from…
A:
Q: 6. Determine the Range and Standard Deviation of the set of data below. 60, 58, 62, 67, 48, S1, 72,…
A: From the given data
Q: 1. In the graph to the following: 120 a. Is the data skewed left or right? b. If one of lines a and…
A:
Q: Compute the geometric mean from the following data : 10, 110, 120, 50, 80, 60, 52, 37.
A:
Q: Consider the following data set: 9, 8, 6, 11, 5, 9, 7, 6, 3, 10, 11, 9, 9, 6, 10, 7, 8, 9, 5, 9…
A: Given- Consider the data; 9, 8, 6, 11, 5, 9, 7, 6, 3, 10, 11, 9, 9, 6, 10, 7, 8, 9, 5, 9 To Find-…
Q: Find the mean (average) for the following set of numbers: x=10,24,29,19,17,1,6,14,8,6
A: From the given information we want to find the mean of the given data.
Q: What is the mean of the following data: 0,0, 1, 1, 1, 2, 2, 2, 3, 3
A: Given data, 0, 0, 1, 1, 1, 2, 2, 2, 3, 3
Q: The following are the ages of the first ten students who enrolled in a certain college. Find the…
A: Mean = sum of the term / number of terms
Q: 4. The website realtor.com listed the following sale prices (in $1000s) for a sample of 10 homes…
A: Since you have posted a question with multiple sub-parts, we will solve the first three subparts for…
Q: The following data represent the number of people aged 25 to 64 years covered by health insurance…
A: Solution-: We prepare the following table: Class Class Boundaries LB UB Mid Point (xi) Number…
Q: Example Calculate mean deviation from mean and median for the following data of heights given in…
A: The objective is to find mean deviation from mean and median for given data…
Q: Please, find the Arthematic Mean, Geomatric Mean, Harmonic Mean, Mode & Median of the given data.…
A: It is a single value within the range of data which represents a group of individuals values in a…
Q: Consider a sample with data values of 27, 25, 21, 15, 31, 33, 28, and 25. Compute the 20th, 25th,…
A: We have to find given percentiles.
Q: If 40% of all the students are taking four classes, and 60% of all the students are taking three…
A:
Q: 9 9.13. Admissions during 1971 to 'Vidya Mandir,' and "Children's Home' increased by 20% and 40%…
A:
Q: ppose that the number of speed-related crash fatalities for the 15 U.S. states that had the highest…
A: Given Data, State Speeding-RelatedTraffic Fatalities Texas 1246 California 915 Pennsylvania…
Q: 10- Daily hours of television EN 20 Relative frequency (%)
A: From the histogram it can be seen that the markers are put after every 2%. The percentage of…
Q: Suppose the following data shows the number of the problems from the Practice Problems Set attempted…
A:
Q: 1. The following are the score of 12 students in Statistics quiz: 86, 94, 90, 76, 95, 72, 82, 91,…
A:
Q: 4. Find the interquartile range for the following data: 4, 5, 7, 5, 17, 5, 4, 12, 14, 12, 18, 5
A: Here we have to find out the interquartile range for given data interquartile range = Q3- Q1For…
Q: Find the mean of the following data. 19, 22, 20, 16, 25, 23, 17, 18 O None of these O 28 O 22 O 20
A:
Q: Appendix D, Compute the mean of the following population values: 6, 3, 5, 7, 6. 2. Compute the mean…
A: Mean or Arithmetic mean; Mean Is defined as the sum of all observations divided by total number of…
Q: 9. The number of stories in the 13 tallest buildings for two different cities is listed below. Which…
A: For comparing variability, uniformity, and consistency of two variables we calculation the…
Q: The following items represent the number of birds observed at a given feeder over the past several…
A: Calculate Mean from the following data96,76,54,64,7,32,72
Q: Calculate the following values: 1) mean,
A: The solution is x x2 -2 4 -4 16 -2 4 5 25 -2 4 -11 121 4 16 -3 9 6 36 5 25…
Q: The following data represent the number of people aged 25 to 64 years covered by health insurance…
A: From the provided information, Age 25-34 35-44 45-54 55-64 Number (millions) 20.1…
Q: Determine the mean of the following data set: 21, 19, 2, 31, 9, 45, 40, 52, 83 State the mean value…
A:
Q: 1-) For the following data, please compute: X= [1 ,2, 2, 3, 3, 3, 4, 4, 4, 4, 5, 5, 5, 6, 6, 6, 7,7,…
A: A) We will first insert all the data into excel and from the excel functions we can get mean ,median…
Q: Who is taller with respect to their own gender? (Men have a mean height of 70.4" with SD 3.0" and…
A:

Step by step
Solved in 2 steps with 2 images
