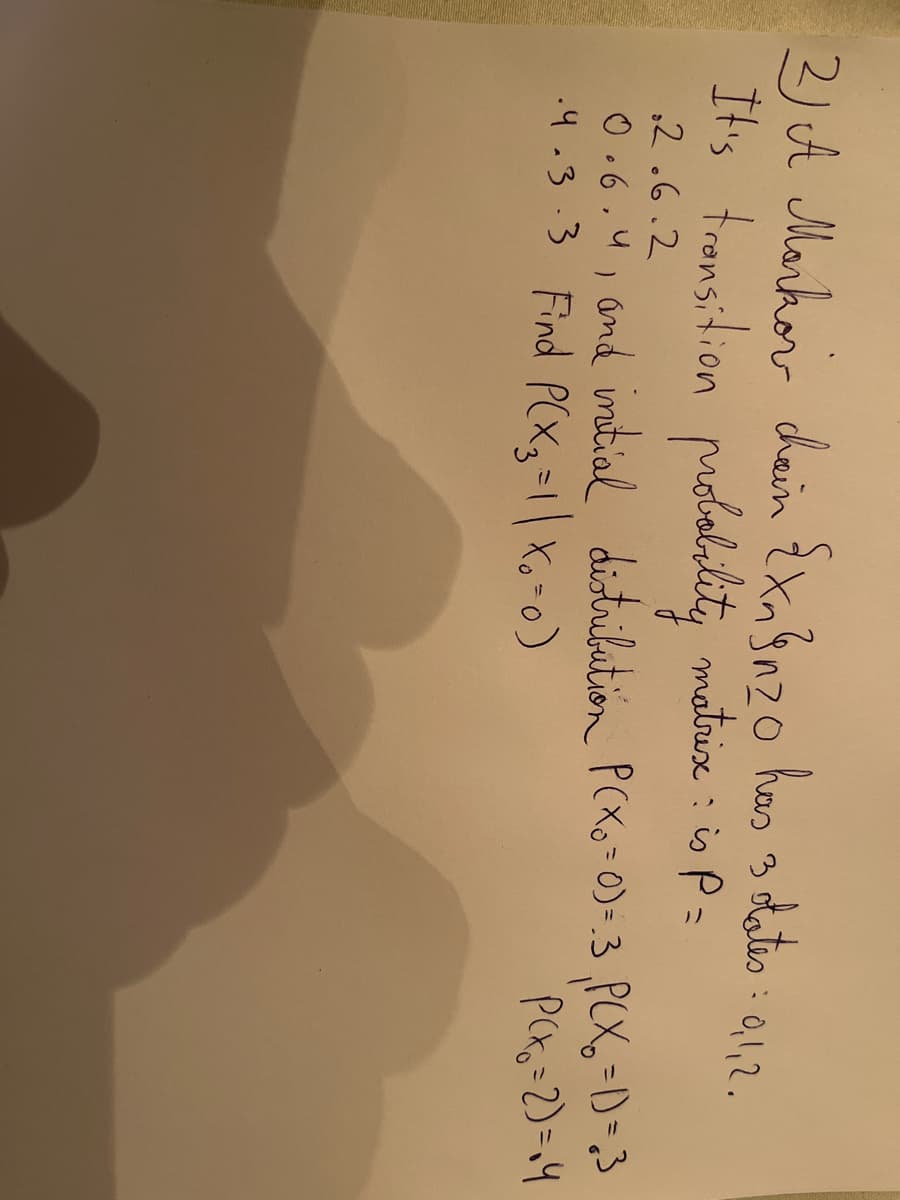
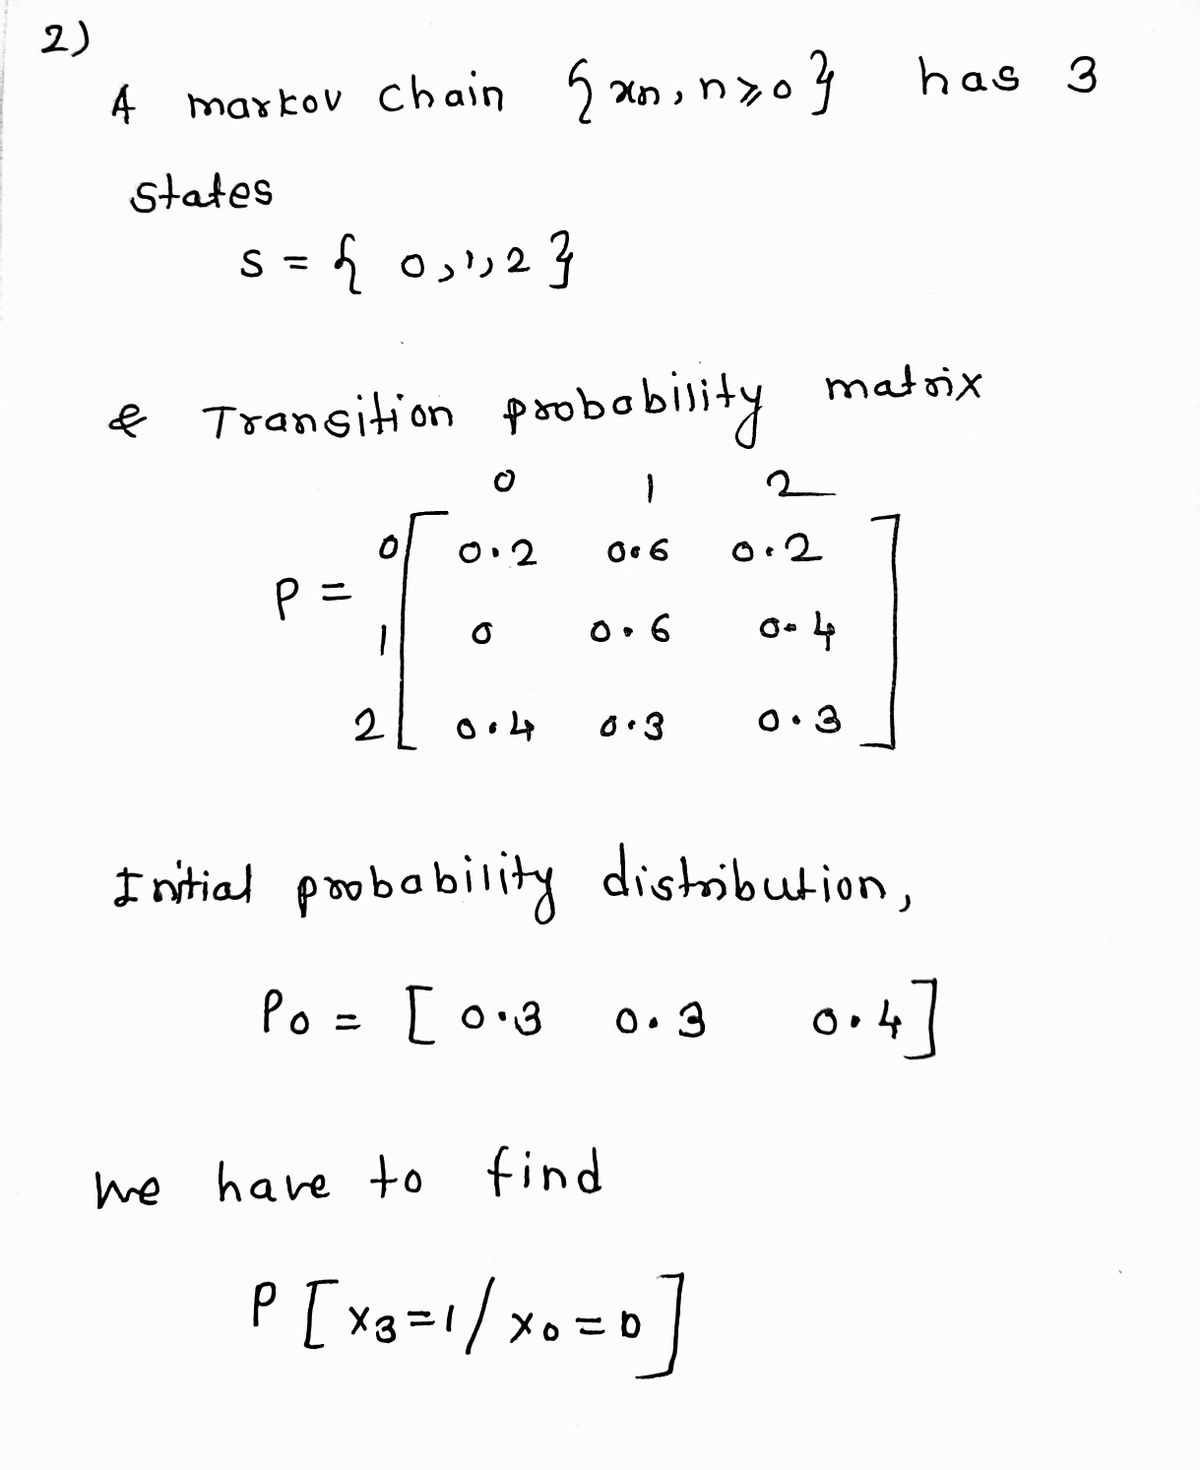
2)A Marhor chain Zxn3nzo has 3 dates : a1,2. It's tronsition mobalility matrix : io P = ,2 .6.2 0.6.4, and imtial distribution PCXO-0)-.3 PCX, =D=3 4.3.3 Find P(X3-1|X-0) PCKo=2)=14


Q: Prepare a 2 × 2 table from the following information and calculate Yule's pefficient of Association ...
A:
Q: From the data given below, calculate the gross and net reproduction rates : Age Group Female Populat...
A:
Q: Provide integer answers to each of the following. Show your work clearly. Nine people are on a local...
A: Introduction: The gardening committee has 9 members, from among whom, the various posts and subcommi...
Q: According to a Survey, households in the city X spend an average of $24 per week on their leisure ac...
A:
Q: A card is chosen from a deck. Find the probability of a spade, red ace, and black face card
A: There are total 52 cards in deck Probability =no. Of Favorable cards/total cards
Q: The fertility rates (average number of chi l per hilar Lil adult woman) for several count tes are sh...
A: Here given fertility rate according to cities. We have interpret the value of median according to op...
Q: Example 10-2. A computer while calculating correlation coefficient between two variables X and Y fro...
A:
Q: Score 36 35 34 33 32 31 30 29 28 1 Frequency 2 4 3 5 4 3 3 4
A: We know that Mean = sum of all observations/total number of observations Median = middle value Mo...
Q: Here are the number of hours that 10 Math 121 students spent studying for a final exam(x) , and thei...
A: Given : Hours Score 7 70 8 76 4 57 9 77 13 91 5 66 9 82 6 64 16 96 3 50
Q: Question: Imagine we have two bonds, whose value can vary between $0 and $100. Assume the joint dist...
A: Given,f(x)=c ; 0≤X≤100, 0≤X≤1000 ; otherwise
Q: Problem 2 I roll a fair die n times. Let X be the number of l's that I observe and let Y be the numb...
A:
Q: A couple has four children. Let "b" = the number of boys they have. What are the possible instances ...
A: Solution: If couple has four children then the sample space S is S= { GGGG, GGGB, GGBG, GBGG, BGGG,...
Q: A bag contains 20 balls numbered from 1 to 20. One ball is drawn at random. Find the probability tha...
A:
Q: 1 In the game of roulette, a player can place a $6 bet on the number 6 and have a probability of win...
A:
Q: 2 An experiment is to have its results examined by analysis of variance. The variable is temperature...
A:
Q: 9. The total frequency of a distribution is 1391. The frequency of a particular item on the distribu...
A: Pie chart is a statistical tool of representing data. In this the circle is divided into numerous ...
Q: What is the height of this graph? There’s one rectangle missing. This graph represents silver in par...
A: We have to find height of missing ractangle.
Q: A maker of soft-drinks is considering the introduction of a new brund. He expects to sell 50,000 to ...
A:
Q: Five boys and four girls are to arrange themselves to form a line. How many arrangements can there b...
A: Here use permutations and concepts of total arrangement
Q: Find the percentile for the data point. Data set: 51 33 41 72 74 75 32; data point 51
A: 51 33 41 72 74 75 32
Q: You are conducting a test of independence for the claim that there is an association between the row...
A: We use formula for chi-square test-statistic (χ2) χ2 = ∑(Oij−Eij)2/Eij
Q: 4. A teacher claims that the median time to do a particular type of mathematics problem is al most 3...
A:
Q: A certain company offers in-home cral HIV testing. According to their website, out of 4,998 persons ...
A: The sensitivity of the test is calculated as the number of diseased that are correctly classified, d...
Q: 5. Ten women are randomly selected and their weights (in lbs.) before and after they are put on a ne...
A: To test if means for two groups (i.e., "the weight before diet" and "weight after diet" in this case...
Q: Q- 5. Calculate the lower and upper quartiles from the following marks distribution. Marks Below 25 ...
A:
Q: Test the claim that the mean GPA of night students is larger than 3.2 at the .05 significance level....
A:
Q: A Teacher believes that students who smoke cigarettes tend to have lower grades. He collects data fr...
A: Given that Random sample=1326 We want to study opinion about on an average students who smoke cigare...
Q: A sample 30, 3-5 years old children were asked to count out loud. The highest number of numbers that...
A: Given Information: Consider the given data: Number counted frequency 1 0 2 0 3 0 4 2 5 ...
Q: irection: Solve the problem write your complete solutions. A study is conducted on the relationship ...
A: Any assumption about the parameter or probability function is known as hypothesis testing. For the g...
Q: If a fair coin is tossed twice, what is the probability of seeing heads exactly once? O a 1/3 O b. 1...
A:
Q: Test the claim that the proportion of people who own cats is larger than 40% at the 0.01 significanc...
A: Given : Claim : The proportion of people who own cats is larger than 40%
Q: 1. In the senior year of a high school graduating class of 120 students, 58 studied mathematics, 73 ...
A: Venn diagram uses circle to represent a set. The overlapping portions of circles represents the elem...
Q: i need the answer quickly
A: Given: There are 25 different cards in the set You buy 8 packs of 5 cards each.
Q: Using the table below and the Agresti-Coull 95% confidence interval equation for proportions (page 1...
A: Confidence interval : The chance that a parameter can fall between two values round the mean is d...
Q: Let X be a continuous random variable with the following PDF fx(2) = {** Į ce to z 20 otherwise wher...
A:
Q: What is the width of this graph?
A: Given that In Histogram final grade score on X axis Frequency on Y axis Formula for width Width=u...
Q: survey was conducted at a community college of 102 randomly se udents who dropped a course in the cu...
A: Let A and B be the two attributes divided into r and s classes respectively and N is the total frequ...
Q: True or false: In a Time-series plot, the vertical axis represents time.
A: The horizontal axis represents the time period and vertical axis represents the data values measured...
Q: A well-known brokerage firm executive claimed that 10% of investors are currently confident of meeti...
A:
Q: 15. The sales of a company rose from 40,000 in March to 48,000 in April 2002. The company's seasonal...
A:
Q: 8. The mean life of a battery is 50 hours with a standard deviation of 6 hours. The manufacturer adv...
A: Disclaimer : Since you have asked multiple question, we will solve the one question for you. If you ...
Q: Consider the following regression model: Weekly Hours = Bo + B1 × Wage + uį Weekly Hours is the aver...
A: Given information: The regression model is given.
Q: In a survey, the researcher assigned political parties as follows: Democrats=1, Republicans=2, and I...
A: Given that In a survey, the researcher assigned political parties as follows: Democrats=1, Republica...
Q: The management at New Century Bank claims that the mean waiting time for all customers at its branch...
A:
Q: Activity 3: Trace the path of the boy going to the other side of the swamp. The answer to each quest...
A: 4)Given P44
Q: Test the claim that the proportion of men who own cats is significantly different than the proportio...
A:
Q: Q3. A car electrician receives an average of 16 customers per day. Compute the following: (a) The pr...
A:
Q: Q - 10 The following table shows the pay-off matrix related to the demand and strategy of a business...
A:
Q: Q1. In a company, it is reported that 62% of employees are concerned about their health con- dition ...
A:
Q: Find the Geometric mean from the following frequency distribution of the marks: Marks No. of student...
A:

Step by step
Solved in 2 steps with 2 images

- 2. Suppose that in Example 2.27, 400 units of food A, 500 units of B, and 600 units of C are placed in the test tube each day and the data on daily food consumption by the bacteria (in units per day) are as shown in Table 2.7. How many bacteria of each strain can coexist in the test tube and consume all of the food? Table 2.7 Bacteria Strain I Bacteria Strain II Bacteria Strain III Food A 1 2 0 Food B 2 1 3 Food C 1 1 1A cellphone provider classifies its customers as low users (less than 400 minutes per month) or high users (400 or more minutes per month). Studies have shown that 80% of people who were low users one month will be low users the next month, and that 70% of the people who were high users one month will high users next month. a. Set up a 2x2 stochastic matrix with columns and rows labeled L and H that displays these transitions b. Suppose that during the month of January, 50% of the customers are low users. What percent of customers will be low users in February? In March?1) Assuming you have a data matrix X that has n rows and p variables and you know both µ and Σ. How is (X- µ)‘Σ-1(X- µ) distributed? 2) Assuming that you don’t know the values of µ and Σ. How is the statistical distance distributed as n-p gets large?
- Then, what does the equation, d/dt Π = MΠ means? (where M is a 4x4 transition rate matrix)Consider the linear model Yi = B0 + B1X1i + B2X2i + ui where ui is the error term and where E(ui|X1i,X2i) = 0, observations (Yi,X1i,X2i) are independent and identically distributed, 0 < E(Y4) < 1, 0 < 1i E(X14i) < 1, 0 < E(X24i) < 1 and where X2i = X12i. Are the OLS estimators Bˆ1 and Bˆ2 of the coe¢cients B1 and B2 unbiased and consistent? Explain.Consider a dynamic system with three states, s_1s1, s_2s2, and s_3s3. Let A = \begin{pmatrix} 0.7&0.3 &0.3 \\0.2& 0.6 & 0.2 \\ 0.1 & 0.1 &0.5 \end{pmatrix}A=⎝⎛0.70.20.10.30.60.10.30.20.5⎠⎞ be the transition matrix such that a_{ij}aij is the probability of moving from s_jsj to s_isi. Let \overrightarrow{x} = \begin{pmatrix}x_1\\x_2\\x_3\end{pmatrix}x=⎝⎛x1x2x3⎠⎞ be a stationery distribution of AA with sum of elements x_1+x_2+x_3=120x1+x2+x3=120. Find x_2x2.
- 4) Here are data on the lengths of male and female roaches (in mm). Your job is to find out if there is adifference between male and female roaches (this should be two sided - why?).males 15.4 13.9 12.7 9.6 6.6 10.7 9.9 13.3 16.2 9.0 11.4 16.6 12.2females 16.7 16.3 12.8 16.9 15.1 12.8 18.7 18.3 8.6 13.6 15.3 16.2 13.4It's up to you to figure out what the best procedure is, what kind of hypotheses to use, which α to use,what test to use, and so on. Make sure you follow all the appropriate steps. You should probably use Ras you’ll get done much quicker. Remember to very clearly state your results in writing. Never turn in just an R printout .Hint: how do you decide which test to use? What kind of distributions do the data have?A cellphone provider classifies its customers as low users (less than 400 minutes per month) or high users (400 or more minutes per month). Studies have shown that 40% of people who were low users one month will be low users the next month and that 30% of the people who were high users one month will high users next month. a. Set up a 2x2 stochastic matrix with columns and rows labeled L and H that displays these transitions b. After many months, how many % of the customers are high users5) If B arises from a matrix A by elementary row operations, what is the relationship between NS(A) and NS(B)?
- Show what correction (using the generalized least squares method) we should use if the form of heteroskedasticity was the following, show mathematically For both a) and b)Consider one application in which either a first order or second order IVP is formed to find a solution in a model problem.Suppose that {Xn} is a Markov chain with state space S = {1, 2}, transition matrix (1/5 4/5 2/5 3/5), and initial distribution P (X0 = 1) = 3/4 and P (X0 = 2) = 1/4. Compute the following: P(X2 =2)