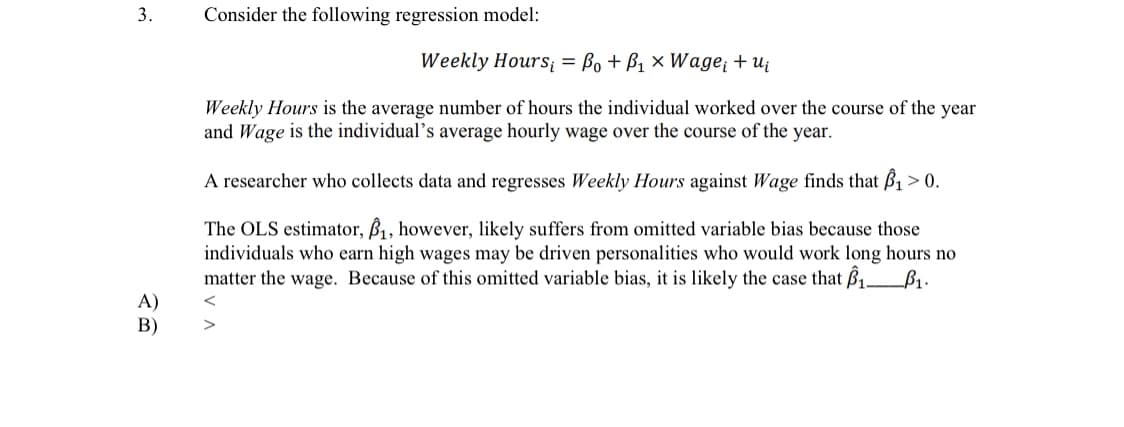
Consider the following regression model: Weekly Hours = Bo + B1 × Wage + uį Weekly Hours is the average number of hours the individual worked over the course of the ye and Wage is the individual's average hourly wage over the course of the year. A researcher who collects data and regresses Weekly Hours against Wage finds that B1> 0. The OLS estimator, B1, however, likely suffers from omitted variable bias because those individuals who earn high wages may be driven personalities who would work long hours no matter the wage. Because of this omitted variable bias, it is likely the case that ß1 B1.
Q: A die is rolled 100 times with the following distribution : Wamber Observed frequency 1 3 4. 6. 17 1...
A:
Q: The website randomizer.org is used to select 30 studdents without repitition from a statistics class...
A: Here given. 35 students selected without repitition from 135 students class to rate the video.
Q: Imagine a scenario where 100 people complete a self-esteem measure. Assume the standard deviation of...
A:
Q: Suppose a population of rice grain sacks has a mean of 180 with a standard deviation of 50 kg. Using...
A: GivenMean(μ)=180standard deviation(σ)=50
Q: The first four moments of a distribution about the value 5 of the variables are 2, 20, 40 and 50. Ca...
A:
Q: 18 Bob is an investment manager. He tells his client that the probability of making a positive retu...
A: Here we have to find the value of standard deviations when probability of making positive return is ...
Q: Exercise 2: Trying to encourage people to stop driving to campus, the university claims that on aver...
A: Given μ=population mean=30+m x̄=sample mean= 24+m n=40 Hypothesis Ho: μ≤30+m Vs H1: μ >30+m...
Q: Do doctors in managed care plans give less charity care? Researchers chose 60 communities at random,...
A:
Q: From the following data, calculate Harmonic Mean : Class-interval : 10-20 20-30 30-40 40-50 50-60 Fr...
A: We have given that, Class interval 10-20 20-30 30-40 40-50 50-60 Frequency 30 75 70 135 220
Q: In a study of cell phone use and brain hemispheric dominance, an Internet survey was emailed to 5000...
A: Given: Sample size(N)=5000 Level of significance = 0.01.
Q: 12. The following table gives the quantity of cement in thousands of tonnes mamuferctured each year ...
A:
Q: A population of 600 semiconductor wafers contains wafers from three lots. The wafers are categorized...
A:
Q: The International Center for Academic Integrity has performed a well designed survey, finding that 6...
A: Givenp=0.68sample size(n)=144mean(μp^)=p=0.68standard deviation(σp^)=p(1-p)144σp^=0.68(1-0.68)144σp^...
Q: The first four moments of a distribution about the value 5 of the variables are 2, 20, 40 and 50. Ca...
A: The assumed rth moment of a variable about any point x=A (i.e., 5 in this case) is given by : μr'=∑f...
Q: Discuss how the coefficient of determination and the coefficient of correlation are related and how ...
A: To discuss how the coefficient of determination and the coefficient of correlation are related and h...
Q: Let x be a normally distributed random variable with the following parameters: μ = 135.628 σ = 28.62...
A: Given that μ = 135.628 , ? =28.622 X~Normal(μ=135.628 , ? =28.622) Find P(x₁ < X < x₂) =0.95 ...
Q: Which of the following do you think could possibly be true statistically? A) A teacher brought 40 c...
A: Given that Which of the following do you think could possibly be true statistically A) A teacher bro...
Q: In 2014, Scotland was considering independence from England, going so far as to take a referendum vo...
A:
Q: It is inferred that the tip amount has a relationship with value of a dinner bill. The collected dat...
A:
Q: Using the table below, find the expected value. Please explain how you derived this answer. X P(X=...
A:
Q: A researcher has devised a new questionnaire that attempts to measure a person's stress level. In do...
A: The questionnaire is the technique, which is used in survey sampling in order to obtain some informa...
Q: Of the 132 bird species in the New Zealand bird population, 38 are extinct. Suppose you randomly sel...
A:
Q: intelligence quotients of 100 freshmen students admitted at the College of Business Administration o...
A: Solution: Given information: Number of classes = 10 Maximum value in the data is 120 Minimum value ...
Q: Let x be a normally distributed random variable with the following parameter: μ = 125 σ = 30 10 ...
A: According to the given information, we have Mean = 125 and Standard deviation = 30
Q: ind the indicated probability in each of the following situations. N n μ σ Probability Answer 1000 ...
A: Given : N n µ σ 1 1000 60 75 6 2 90 36 108 3.46 3 250 100 35.6 4.89 4 5000 60 125 13.4
Q: A high school football coach is trying to decide which quarterback he should start in next week's ga...
A:
Q: The first four moments of a distribution about the value 5 of the variables are 2, 20, 40 and 50. Ca...
A: Given The first four moments of a distribution about the value 5 of the variables are 2, 20, 40 and ...
Q: Question 4 According to a study done by Pierce College JBLM, the height for Hawaiian adult males is...
A: Given that μ = 66 , ? = 2.5 X~Normal(μ = 66 , ? = 2.5 ) Find P(63.5<X<68.5) Formula for Z-sco...
Q: A physics class has 40 students. Of these, 16 students are physics majors and 14 students are female...
A: Given that Total students=40 Physic majors=16 Female=14 Female and Physic majors=4
Q: When a customer calls the customer service line of XYZ Company, the amount of time that a customer m...
A:
Q: What is the height of this graph? There’s one rectangle missing. This graph represents silver in par...
A: We have to find height of missing ractangle.
Q: The amount of miraculin produced in a hybrid tomato plant had a mean of 105.3 micrograms per gram of...
A: Given that Miraculin produced in hybrid tomato plant has mean of 105.3 and standard deviation of 8....
Q: The weights of bags of cookies are normally distributed with mean of 15 ounces and a standard deviat...
A: Given information- Population mean, µ = 15 ounces Population standard deviation, σ = 0.085 ounce We ...
Q: The joint probability distribution of the number of cars X and the number of buses Y per signal cycl...
A: It is given that the variable x denotes the number of cars and the y denotes number of buses.
Q: The amount of detergent in a box of a particular detergent has a uniform distribution with c=24 and ...
A: Given that X ~ Uniform( a = 25.9 , b = 26.2 ) c = 24, d = 28
Q: Tests in a university's statistics classes have scores with a standard deviation equal to 14.1. One ...
A:
Q: A multiple choice test has 12 questions, with each question having five choices. The number of diffe...
A: Given,Total no.of questions=12
Q: 16 Jane is a financial advisor. She informs a client that the expected return on a portfolio is ...
A: Solution: Let X represent the expected return on a portfolio. Assumed that X has approximately n...
Q: 43. What is the value of E(X - 2) for the scores: 1, 2, -2, 4, 5?
A: Here given that: Score( x) : 1, 2, -2, 4, 5 Make a table of x and (x - 2) Then sum the column (x - ...
Q: Identify the sample space of the probability experiment and determine the number of outcomes in the ...
A: We have given that, The sample space of the probability experiment and determine the number of outc...
Q: Discuss the concept of the "Law of Large Numbers" and its role in the discipline of probability.
A: We have to discuss the concept of the " Law of Large Numbers" and its role in the discipline of prob...
Q: After each spin, you advance the number of spaces indicated. (a) What is the expected number of spac...
A: A spinner is given where the number of spaces are placed in pie sections as: Number 4 Covers 90 degr...
Q: a. What is the probability that it will not rain on the first day? b. What is the probability that i...
A: HERE given odds of rain on first day is 3:5 odds of rain on second day is 2:7 probability = odds 1+...
Q: omplete the table below. Experiment Number X or the Types of Random Random Variable X Variable Numbe...
A: For the given Experiments determine the Random variable x Types of random variable
Q: 0.99 0.84 0.93 0.99 0.72 0.87 0.88 0.85 0.84 0.86 0.81 0.81 0.82 0.76 0.77 0.83 0.7 0.83 0.82 0.97 0...
A: Random samples of 50 candies with weights (in grams) given. We need to find the sample standard of ...
Q: Identify the class width, class midpoints, and class boundaries for the given frequency distribution...
A: For given data, Class Width, Midpoints and boundaries have to be determined.
Q: Campus athletics is interested in the proportion of registered students living on campus who play ba...
A: We are given that 95% confidence interval is correctly calculated from the given data as (0.12, 0.18...
Q: Find the probability that (a) Your friend will have to wait more than 10 minutes. (b) You will have ...
A:
Q: Pbtain the probability distribution of X, the mumber of heads in three tosses of a coin (or a simult...
A: When we toss three coins then the sample space S is given by S = { HHH, HHT, HTH, THH, TTH, THT, HTT...
Q: If 6 of these CDs are randomly selected for testing, what is the probability that the entire batch w...
A: It is given that Total number of CDs = 6500 Number of defectives = 140 Number of non defectives = 65...
Step by step
Solved in 2 steps
- Olympic Pole Vault The graph in Figure 7 indicates that in recent years the winning Olympic men’s pole vault height has fallen below the value predicted by the regression line in Example 2. This might have occurred because when the pole vault was a new event there was much room for improvement in vaulters’ performances, whereas now even the best training can produce only incremental advances. Let’s see whether concentrating on more recent results gives a better predictor of future records. (a) Use the data in Table 2 (page 176) to complete the table of winning pole vault heights shown in the margin. (Note that we are using x=0 to correspond to the year 1972, where this restricted data set begins.) (b) Find the regression line for the data in part ‚(a). (c) Plot the data and the regression line on the same axes. Does the regression line seem to provide a good model for the data? (d) What does the regression line predict as the winning pole vault height for the 2012 Olympics? Compare this predicted value to the actual 2012 winning height of 5.97 m, as described on page 177. Has this new regression line provided a better prediction than the line in Example 2?Suppose a study wants to predict the market price of a certain species of turtle (Y) based on the following independent variables indicated in the table. Based from the table, what is the equation of the multiple linear regression? (Round off up to two decimal places. Market Price = 0.07 - 0.40*weight + 1.51*length + 1.41*width + 0.80*age Market Price = - 0.40*weight + 1.51*length + 1.41*width + 0.80*age Market Price = 0.07 + 0.40*weight + 1.51*length + 1.41*width + 0.80*age Market Price = 0.07 - 0.40 + weight + 1.51 + length + 1.41 + width + 0.80 + age17) Suppose that Y is normal and we have three explanatory unknowns which are also normal, and we have an independent random sample of 41 members of the population, where for each member, the value of Y as well as the values of the three explanatory unknowns were observed. The data is entered into a computer using linear regression software and the output summary tells us that R-square is 0.9, the linear model coefficient of the first explanatory unknown is 7 with standard error estimate 2.5, the coefficient for the second explanatory unknown is 11 with standard error 2, and the coefficient for the third explanatory unknown is 15 with standard error 4. The regression intercept is reported as 28. The sum of squares in regression (SSR) is reported as 90000 and the sum of squared errors (SSE) is 10000. From this information, what is the number of degrees of freedom for the t-distribution used to compute critical values for hypothesis tests and confidence intervals for the individual…
- 9)Suppose that Y is normal and we have three explanatory unknowns which are also normal, and we have an independent random sample of 11 members of the population, where for each member, the value of Y as well as the values of the three explanatory unknowns were observed. The data is entered into a computer using linear regression software and the output summary tells us that R-square is 0.79, the linear model coefficient of the first explanatory unknown is 7 with standard error estimate 2.5, the coefficient for the second explanatory unknown is 11 with standard error 2, and the coefficient for the third explanatory unknown is 15 with standard error 4. The regression intercept is reported as 28. The sum of squares in regression (SSR) is reported as 79000 and the sum of squared errors (SSE) is 21000. From this information, what is the adjusted R-square? .8 .7 NONE OF THE OTHERS .6 .58)Suppose that Y is normal and we have three explanatory unknowns which are also normal, and we have an independent random sample of 11 members of the population, where for each member, the value of Y as well as the values of the three explanatory unknowns were observed. The data is entered into a computer using linear regression software and the output summary tells us that R-square is 0.86, the linear model coefficient of the first explanatory unknown is 7 with standard error estimate 2.5, the coefficient for the second explanatory unknown is 11 with standard error 2, and the coefficient for the third explanatory unknown is 15 with standard error 4. The regression intercept is reported as 28. The sum of squares in regression (SSR) is reported as 86000 and the sum of squared errors (SSE) is 14000. From this information, what is MSE/MST? .5000 NONE OF THE OTHERS .2000 .3000 .4000Given the equation of a regression line is y= -1.5x-1.8, what is the best predicted value for y given x= -3.0? Assume that the variables x and y have significant correlation.
- In a laboratory experiment, data were gathered on the life span (y in months) of 33 rats, units of daily protein intake (x1), and whether or not agent x2 (a proposed life-extending agent) was added to the rats' diet (x2 = 0 if agent x2 was not added, and x2 = 1 if agent was added). From the results of the experiment, the following regression model was developed:ŷ = 36 + .8x1 − 1.7x2Also provided are SSR = 60 and SST = 180.The test statistic for testing the significance of the model is _____. a. 5.00 b. .50 c. .25 d. .33The following table shows the annual number of PhD graduates in a country in various fields. NaturalSciences Engineering SocialSciences Education 1990 70 10 70 30 1995 130 40 110 50 2000 330 130 280 140 2005 490 370 460 210 2010 590 550 830 520 2012 690 590 1,000 900 (a) With x = the number of social science doctorates and y = the number of education doctorates, use technology to obtain the regression equation. (Round coefficients to three significant digits.) y(x) = Graph the associated points and regression line. (b) What does the slope tell you about the relationship between the number of social science doctorates and the number of education doctorates? The slope tells us the increase in the number of social science doctorates for each additional education doctorate.The slope tells us the increase in the number of education doctorates for each additional social science doctorate. The slope tells us the decrease in the number…The following table shows the annual number of PhD graduates in a country in various fields. NaturalSciences Engineering SocialSciences Education 1990 70 10 60 30 1995 130 40 120 50 2000 330 130 280 140 2005 490 370 460 210 2010 590 550 830 520 2012 690 590 1,000 900 (a) With x = the number of social science doctorates and y = the number of education doctorates, use technology to obtain the regression equation. (Round coefficients to three significant digits.) y(x) = Graph the associated points and regression line. (b) What does the slope tell you about the relationship between the number of social science doctorates and the number of education doctorates? The slope tells us the increase in the number of education doctorates for each additional social science doctorate.The slope tells us the decrease in the number of education doctorates for each additional social science doctorate. The slope tells us the increase in the number…